
Comparisons with previous data are often present in all reports in one way or another. This information helps to understand the trends - where the business is heading, whether we are growing and our activities are helping the company to develop, or whether we are going through a period of stagnation, or vice versa, the situation is getting worse.
"Better" / "worse" are words of comparison. And it is important for businesses not only to understand how advertising launched a month ago works, but also to see the wider picture. Calculations at the years level help with this - year-over-year comparisons by months and with year-to-date totals. Today we will talk about them.
But before that, let me remind you: in one of my previous articles, I already wrote about one of the ways to compare data in Power BI - automatic comparison with the previous period. If this is also relevant to you, I'll leave the link to that article here.
And today's plan is as follows:
Getting acquainted with the data model
As always, I don't want to waste your attention and take only what is necessary for the calculations. Of course, I work with more diverse tables, but in this article, the data that is not used in the measures will only distract.
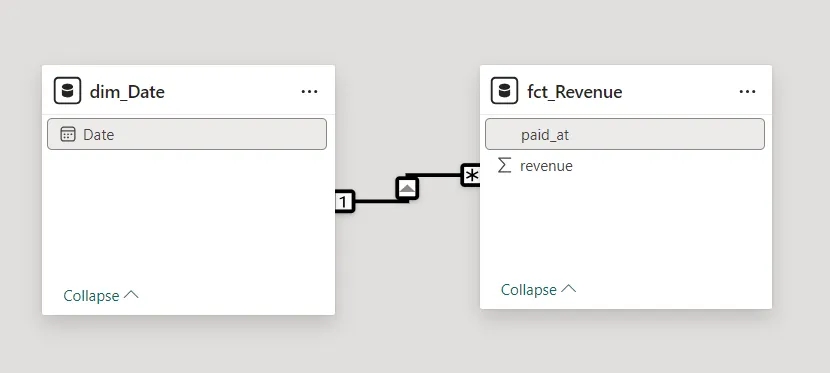
As you can see, we actually need only the dates of income and the income itself.
Since dates require a separate calendar table, I created it and linked it to the main income table.
There are many ways to create a calendar. The fastest way is to create it in DAX using the CALENDAR function of the same name, to which you need to add 2 arguments - the start and end date. They can be either specified manually or set dynamically based on, for example, a fact table. Both of these methods are described in the documentation for this function.
Writing year-over-year comparison calculations
In order to compare revenue, we need an initial measure that will count the amount, and that we will use in subsequent measures to model the filter context to calculate revenue for the period to compare. If you are struggling with understanding the filter context, I completely understand you. I highly recommend watching this video with a visual demonstration of how this context works in Power BI.
Total revenue measure
And the measure of revenue calculation is very simple - it is the sum of the values in the revenue column:
Total Revenue = SUM(fct_Revenue[revenue])
Previous year's revenue measure
The fun begins now with the filter context modeling.
The year-over-year comparison compares the value of the selected year at the level of quarters/months/days, if necessary, with the same period of the previous year.
Thus, we compare, for example, the revenue of January 2024 with January 2023, or the first quarter of 2024 with the first quarter of 2023, etc.
Whatever the level of breakdown of the period, you need to calculate the revenue with a shift of one year back.
Power BI has a very obvious function for this, because this calculation is extremely popular. Therefore, all you need to do is use the SAMEPERIODLASTYEAR filter modifier in the CALCULATE function along with the [Total Revenue] measure we created in the previous step, which takes only one argument - a date column from the calendar table.
Total Revenue PY =
   CALCULATE(
       [Total Revenue],
       SAMEPERIODLASTYEAR(dim_Date[Date])
   )
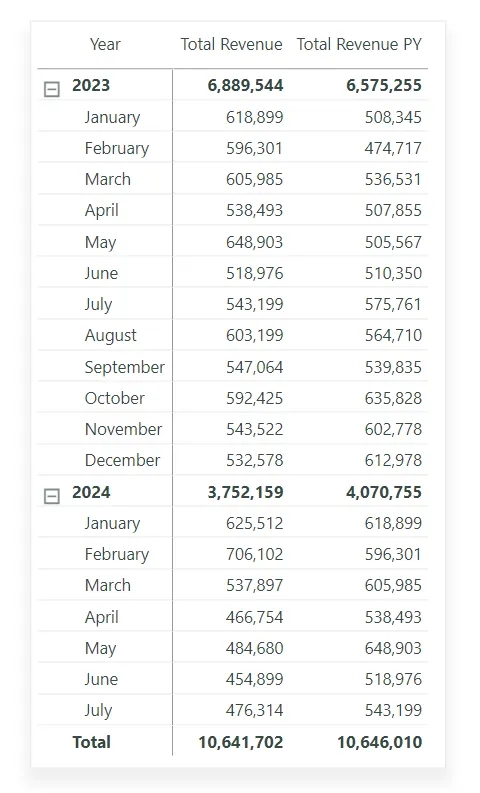
As a result, we can see in the table that the amount of Total Revenue PY opposite January 2024 is equal to the amount of Total Revenue opposite January 2023. And so on, by month.
You may have thought that Power BI has a lot of such special functions, and you need to spend a lot of time to learn them all and only then work with PBI properly.
If you thought so, you are mistaken - you need to understand and really memorize only the basic principles: filter context, row context, and a dozen of simple functions to work with this tool more or less confidently.
SAMEPERIODLASTYEAR can actually be replaced with a simpler function - DATEADD. It's simpler because it's more common and versatile, although it has a few more arguments. If you work with BigQuery, you probably know similar functions - DATE_ADD and DATE_SUB.
Here's a measure with DATEADD that also takes a list of dates from a calendar and expects us to specify an offset period and interval - minus one year:
Total Revenue PY2 =
    CALCULATE(
        [Total Revenue],
        DATEADD ( dim_Date[Date], -1, YEAR )
    )
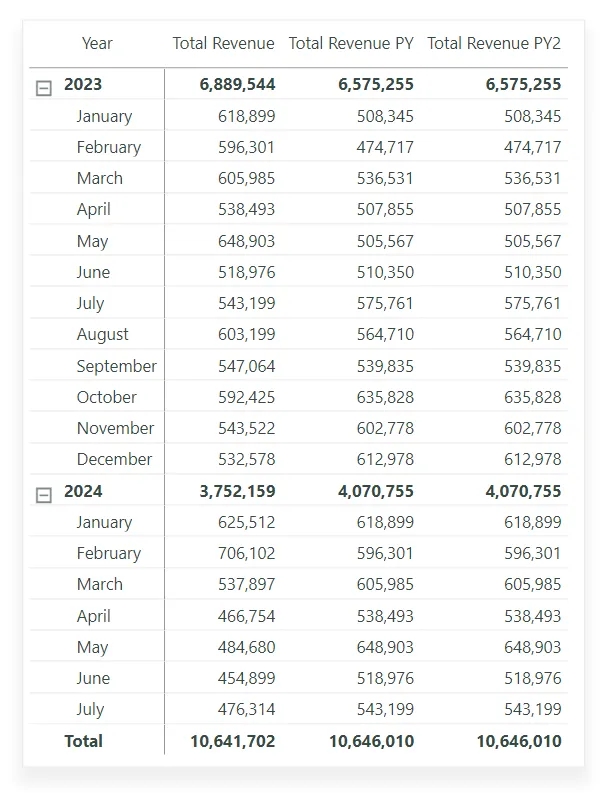
The result in this case, of course, is the same as with SAMEPERIODLASTYEAR, but unlike this modifier, with DATEADD you can set other periods in the future and past, not just one year in the past. My idea was as follows: knowing the simpler and more universal functions in PBI, you will be able to write quite complex and interesting calculations, even without knowing anything specific.
Comparing the data
This measure is extremely easy:
Total Revenue YOY % =
    DIVIDE(
        [Total Revenue] - [Total Revenue PY],
        [Total Revenue PY]
    )
In fact, we divide the difference between this year's and last year's revenue by the value of last year'srevenue. The matrix with a breakdown by month does the rest - it calculates the metric by month or year in each row of the table:
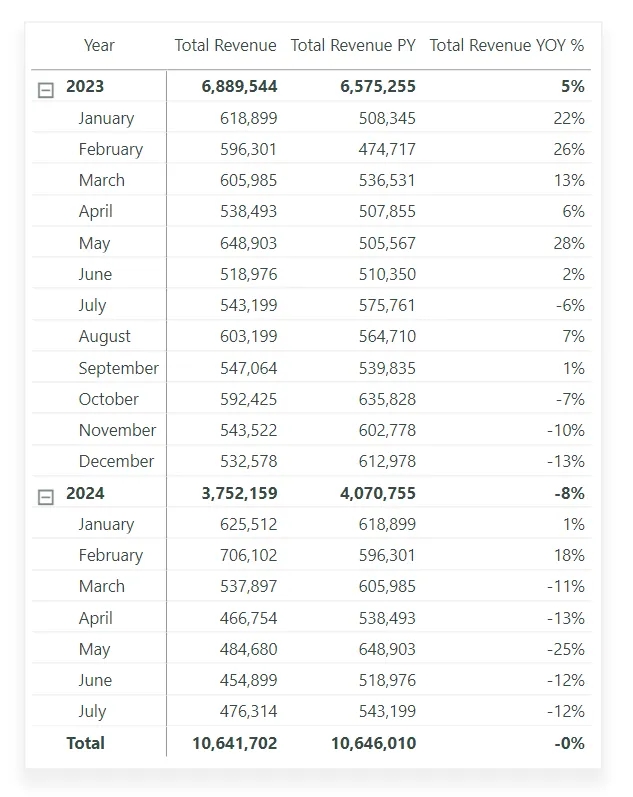
In this rather simple way, with a minimum of data, we showed the business that things were going well in the first half of 2023, then there was a period of stagnation, and now things are not going well, and certain strategic decisions need to be made.
Writing a year-to-date comparison
The next calculation, in my opinion, is a logical continuation of the previous one and expands the picture of the company's development from year to year.
Year-to-date measure
This calculation is also very popular, so PBI has a separate function that calculates the amount from the beginning to the end of the year.
This function is TOTALYTD. It has 4 arguments, but usually 2 are used, which are mandatory, namely: the first is the main measure of the amount of revenue, the second is a list of dates from the calendar. The third argument is a filter that can be added, and the fourth is the end of the fiscal year. Learn more about this function here.
Total Revenue YTD =
    TOTALYTD(
        [Total Revenue],
        dim_Date[Date]
    )
As you can see, the function is very concise, but it's not very obvious what it does. Again, if you don't know something specific, you can write it using other, more universal functions and in a more obcvious way.
What is a year-to-date calculation?
This is the sum of the indicator from the beginning of the year to the current line. In our case, we are interested in calculating the following:
- the amount in January is the revenue for January;
- the amount in February is the revenue for January + February;
- the amount in March is the revenue for January + February + March;
- and so on until the end of the year;
- at the beginning of the next year, the amount starts from zero;
The previous paragraph on the DAX looks like this:
Total Revenue YTD2 =
VAR maxDate = MAX(dim_Date[Date])
VAR yearStart = DATE( YEAR(maxDate), 1, 1)

RETURN
    CALCULATE(
        [Total Revenue],
        dim_Date[Date] >= yearStart,
        dim_Date[Date] <= maxDate
)- In the maxDate variable, we store the last date in the current context - in a matrix with a breakdown by months, this will be the last day of each month.
- In the yearStart variable, we store the beginning of the year in the current context. The DATE function takes 3 arguments - year, month, and day. We take the year using the YEAR function from the first variable, and the first day of the year is always the first month and the first day.
- In RETURN, we use the CALCULATE function with our usual revenue measure, and in the filter arguments we "tell" it to calculate the amount of revenue for the period between the beginning of the year and the current date in the visual.
- The result of both measures is the same:
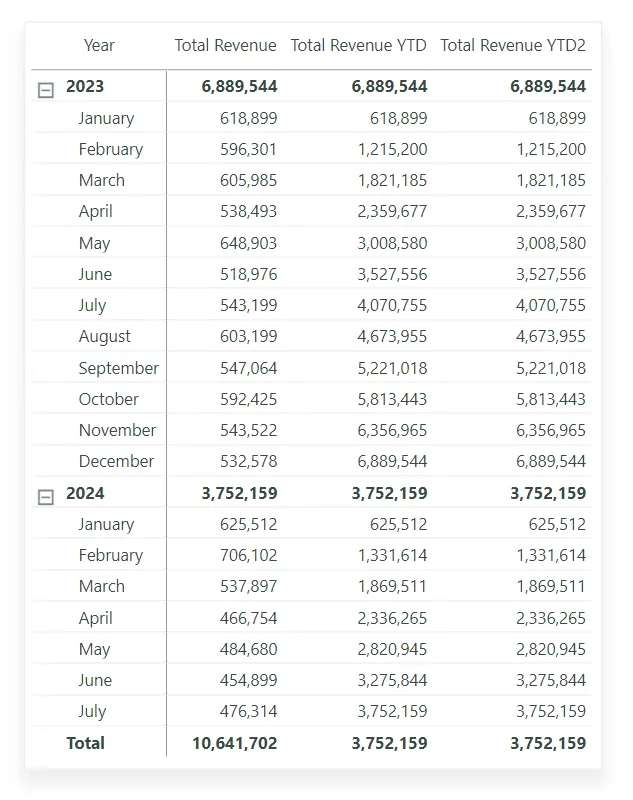
But knowing the second approach, you can calculate it even when you don't have data from the beginning of the year. There was a case when the revenue in CRM began to be recorded in February, and the plan was developed only in March. The task was to compare the year-to-date plan/fact. TOTALYTD would have calculated incorrectly - the plan from March, the fact from February. This can only be calculated using an approach similar to the second one, and not by concise functions created for ideal data models.
Year-to-date for the previous year
Let me introduce you to another function - PARALLELPERIOD. It has 3 arguments - a list of calendar dates, the number of the offset period, and the offset interval.
Let's use this function in a measure:
Total Revenue PRY =
    CALCULATE(
        [Total Revenue],
        PARALLELPERIOD(dim_Date[Date], -1, YEAR)
    )
You probably noticed that it is very similar to DATEADD ( dim_Date[Date], -1, YEAR ), but there is one big difference - PARALLELPERIOD returns the amount for the selected interval. We have specified minus 1 year, so we will get the amount of revenue for the entire previous year, regardless of the breakdown by month:
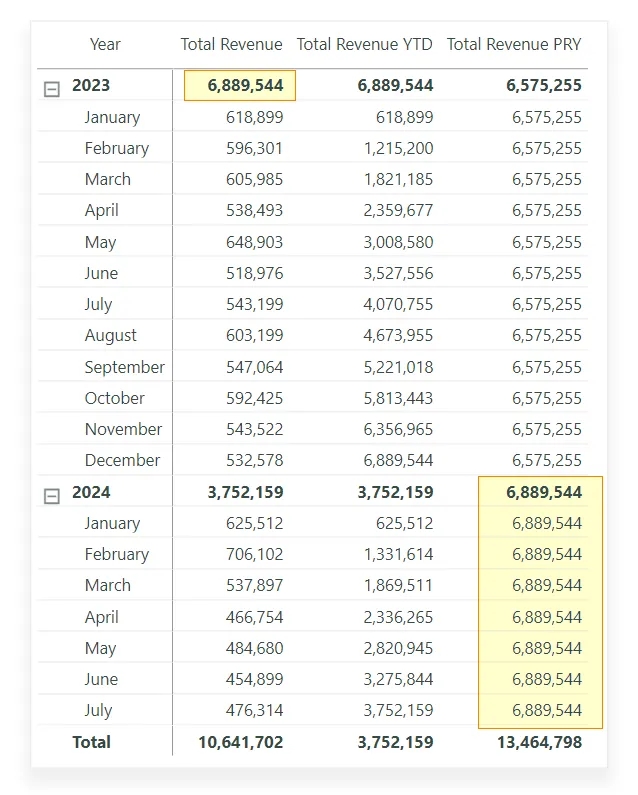
Percentage of the previous year
Yes, we already have everything we need to calculate this, so all we need to do is calculate the percentage: divide the year-to-date measure by the previous year's total.
Total Revenue PRY % = DIVIDE([Total Revenue YTD], [Total Revenue PRY])
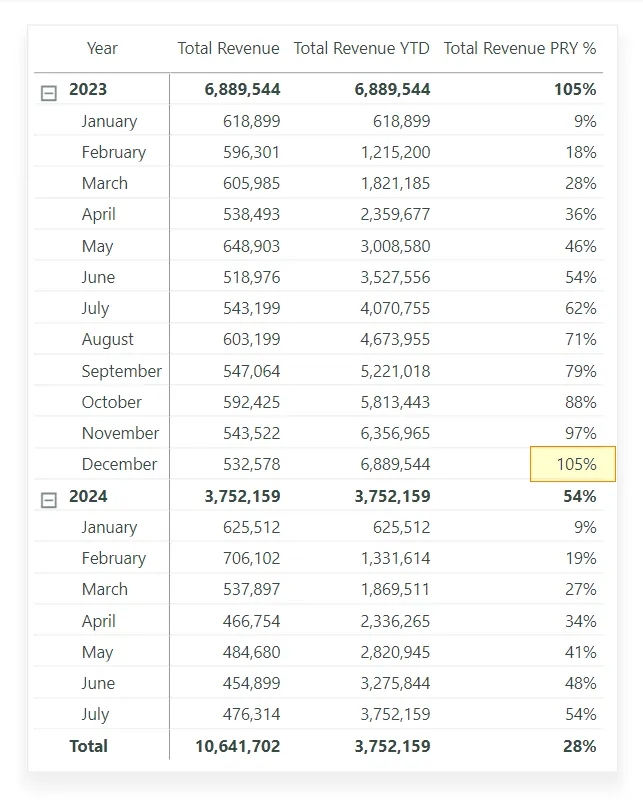
Usually, it's good when we reach 100% around October-November. The following percentages are our growth for the year. As you can see in the screenshot above, in 2023 we received 5% more than in 2022.
Visualizing the calculations
Of course, it's boring to analyze in boring tables, so let's visualize it. In a bar chart, we will compare year-over-year by month, and in a graph, we will display year-to-date calculations for this year and the previous year.
By the way, year-to-date measure for the previous year is also very simple - just use the appropriate measure in the first argument:
Total Revenue PYTD =
    TOTALYTD(
        [Total Revenue PY],
        dim_Date[Date]
    )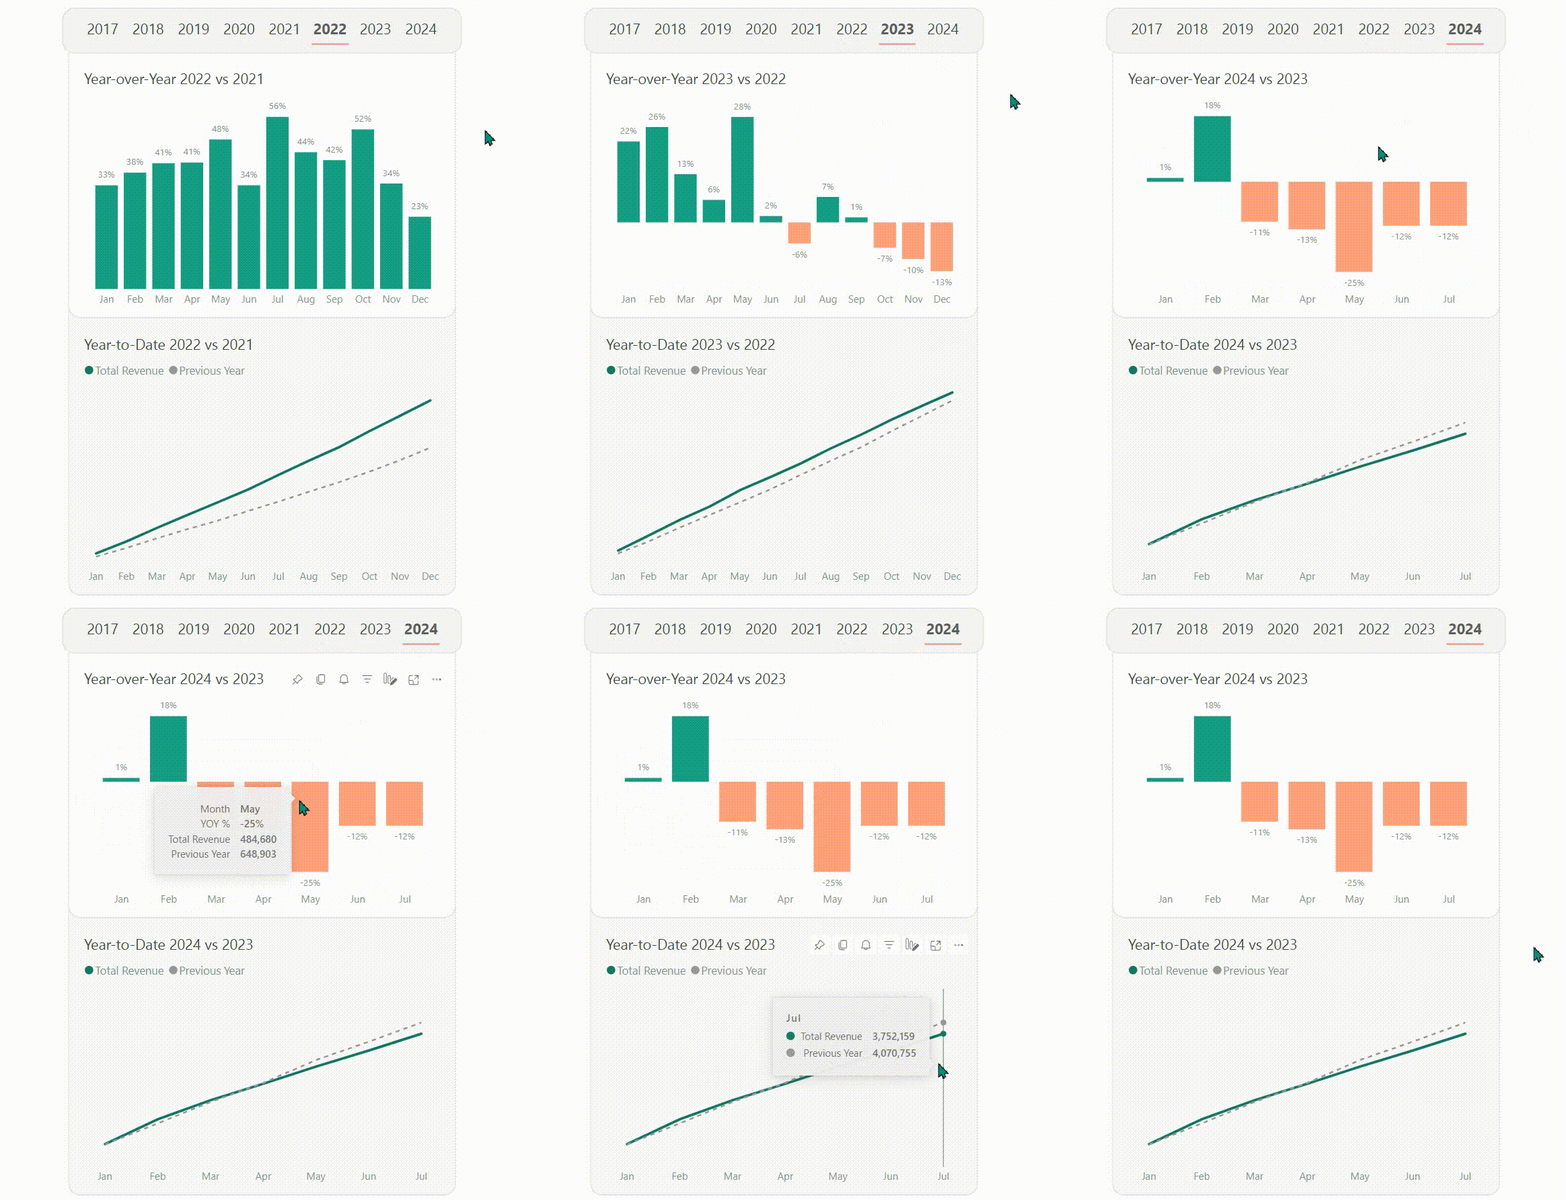
The Year-over-Year visual uses the Total Revenue YOY % measure.
The Year-to-Date visual uses Total Revenue YTD and Total Revenue PYTD.
Conclusion
In this article, we have analyzed very useful calculations that help you understand annual trends both by month, which takes into account seasonality, and by total, from the beginning of the year.
I think you've seen that it's quite easy and quick to calculate this in Power BI, and the value of such insights for business is hard to overestimate. I hope you'll find this approach useful in your reports.
And as always, leave your questions and comments below. Also write about what else you would be interested and useful to read about - maybe I will write the next article for you)
Loading comments…