
If you are a user with experience in Power BI and have created several dashboards, you probably know how important it is to use filters to create convenient and adaptive reports. Filters allow each user to receive only the information that is relevant to them.
What are filters?
Filters are a magic wand for all of us. Even in everyday life, we constantly use filters. For example, when searching through an endless variety of products in an online store, to narrow down the results to laptops with specific characteristics, you need to refine the parameters by which you choose a model (RAM, price, brand, availability, etc.). Essentially, you are filtering out data that you do not need at the moment. This is what filtering means. In Power BI reports, filters can be created that operate on a similar principle.
Now let's move to the technical part. Here's our plan:
Types of filters
Personally, I would divide filters in Power BI into two types: those formed based on static data and those formed based on dynamic data.
What do I mean by static data?
For example, data from a specific column in a table or reference data. Of course, you might say that data in tables can change, and consequently, the data in the filter as well—and I agree with you. However, this data will change only during a data model refresh and then remain unchanged. Let’s refer to such filters as static filters going forward. An example of a static filter is a filter by traffic sources. In this filter, only the available values from the reference data/column are displayed, for instance, google / cpc, google / organic.
Static filters are relatively easy to implement, so we won't dwell on them.
However, it is worth noting that the only downside of static filters is that they do not always address all tasks. In this article, we will explore another type of filter that solves the problem of filtering dynamic data.
A part of the data that can change dynamically in Power BI is measures. Filters based on one or several measures will be referred to as dynamic filters in this article.
They are indispensable in cases where the data depends on other parameters or calculations. Here are some real-life examples of using dynamic filters:
- To display segments where expenses exceed the average for the past month.
- To show orders whose execution time exceeds a certain calculated threshold.
- To isolate employees with the lowest performance metrics.
- To display sales deviations compared to a previous period.
Let’s look at how to implement such a filter using the last example.
Suppose we need to display sales by product categories compared to a previous period and evaluate the percentage of deviations in sales. We will assess deviations within predefined segments:
- Critical Deviation: Deviation below -40%.
- Moderate Deviation: Deviation from -20% to -40%.
- Minor Deviation: Deviation from -20% to 0%.
- Positive Deviation: Deviation above 0%.
Step-by-step implementation of a dynamic filter in Power BI
1. Creating Measures
In our task, we first need to calculate a measure that represents the deviation percentage:
Deviation From Previous Period =
DIVIDE(
    [Purchases] - [Purchases prev],
    [Purchases prev],
    0
)- [Purchases] is a measure calculating the total sales for the current period.
- [Purchases prev] is a measure calculating the sales for the previous period (essentially, it calculates [Purchases] but activates the date link that reflects the previous period for calculations).
- DIVIDE ensures safe division; if Purchases prev equals zero, the result will be 0.
This measure allows us to evaluate how much sales have changed between periods.
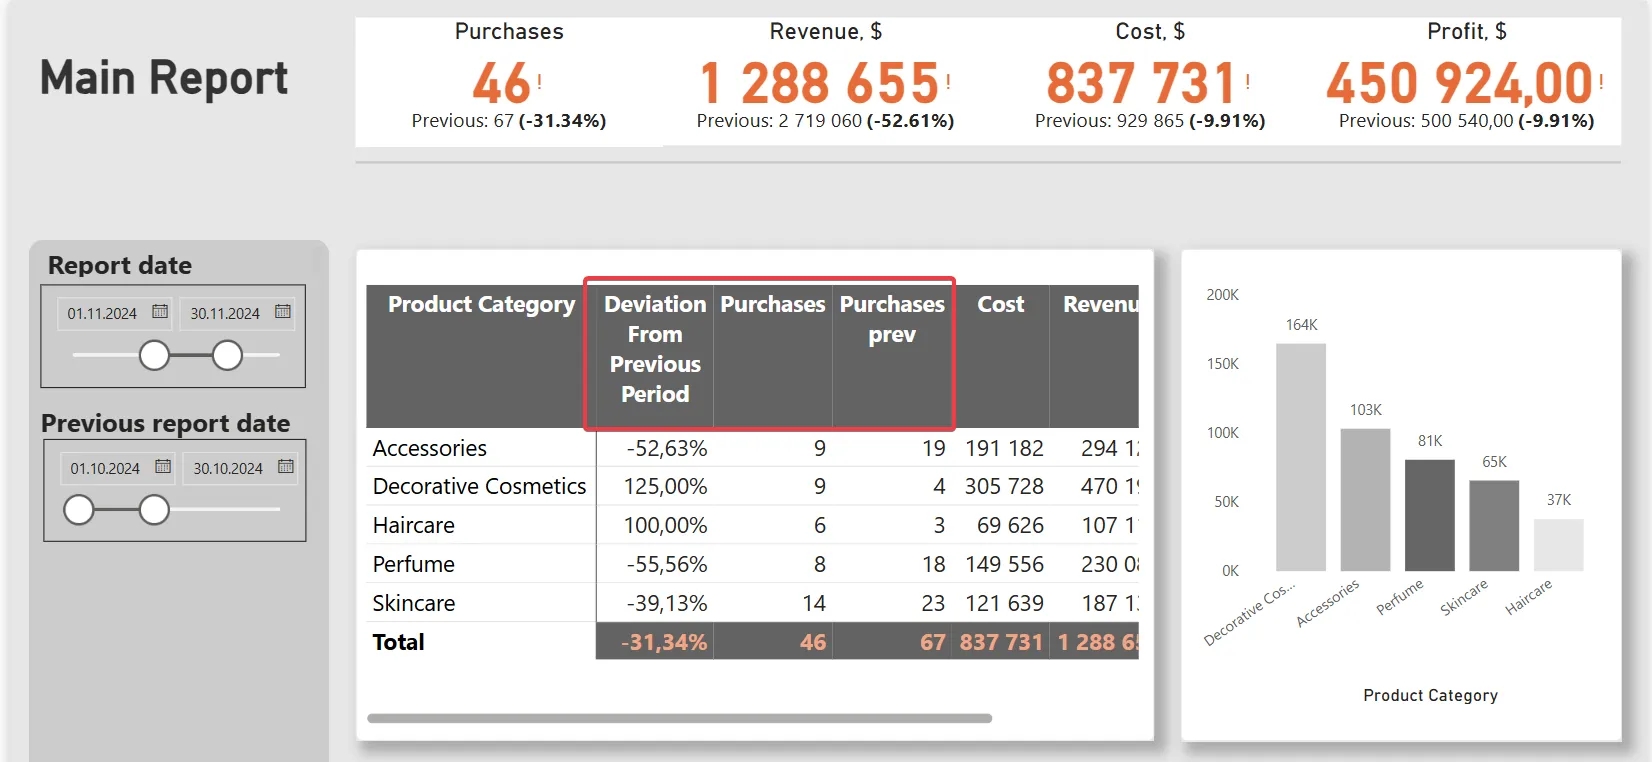
I skipped the calculation of the actual sales because it may differ for everyone, but to simplify the perception of the information, I will include a screenshot of the table where I added this data:
Next, a measure is created to segment deviations by levels:
- Critical Deviation: Deviation below -40%.
- Moderate Deviation: Deviation between -20% and -40%.
- Minor Deviation: Deviation between -20% and 0%.
- Positive Deviation: Deviation greater than 0%.
Filtered Purchases % =
SWITCH(
    TRUE(),
    SELECTEDVALUE(ProductCategoryFilter[Filter]) = "Moderate Deviation" && [DeviationFromPreviousPeriod] < -0.20 && [DeviationFromPreviousPeriod] >= -0.40, 1,
    SELECTEDVALUE(ProductCategoryFilter[Filter]) = "Critical Deviation" && [DeviationFromPreviousPeriod] < -0.40, 1,
    SELECTEDVALUE(ProductCategoryFilter[Filter]) = "Minor Deviation" && [DeviationFromPreviousPeriod] >= -0.20 && [DeviationFromPreviousPeriod] <= 0, 1,
    SELECTEDVALUE(ProductCategoryFilter[Filter]) = "Positive Deviation" && [DeviationFromPreviousPeriod] > 0, 1,
    SELECTEDVALUE(ProductCategoryFilter[Filter]) = "All", 1,
    0
)
I use 1 to highlight categories that match a specific level of deviation. In this case, 1 represents True in the binary system, and later we will use this to display product categories in the table.
You might have noticed that in the final measure, there are not 4 but 5 segments. For convenience, I added an additional option where it is possible to select all data (All) in the filter.
2. Creating a table for the interactive filter
To display the filter, we create a table with text values representing our deviation levels:
PurchasesFilter =
DATATABLE(
    "Filter", STRING,
    {
        {"Moderate Deviation"},
        {"Critical Deviation"},
        {"Minor Deviation"},
        {"Positive Deviation"},
        {"All"}
    }
)- DATATABLE creates a table directly within the Power BI data model.
- The Filter column contains text values displayed in the filter.
At this stage, I would like to emphasize that this table has no connections to other data, allowing it to function solely as a filter.
3. Integration into the Report
Перевірка відображення даних
Temporarily add the measure Filtered Purchases % to your main table and verify that it returns the correct values for different segments in the Purchases filter.
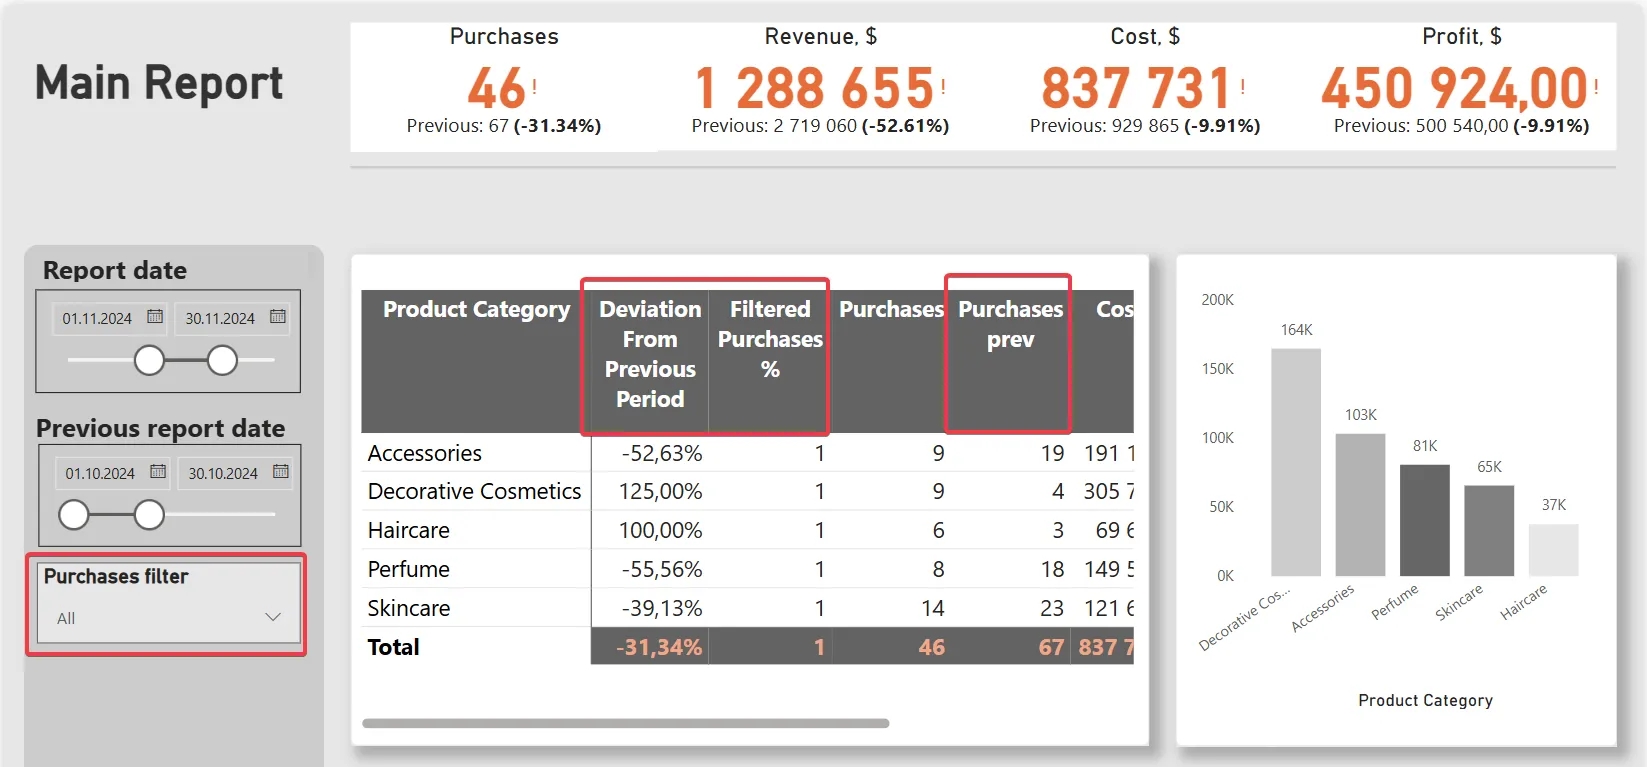
In our case, we will check the data for November and October.
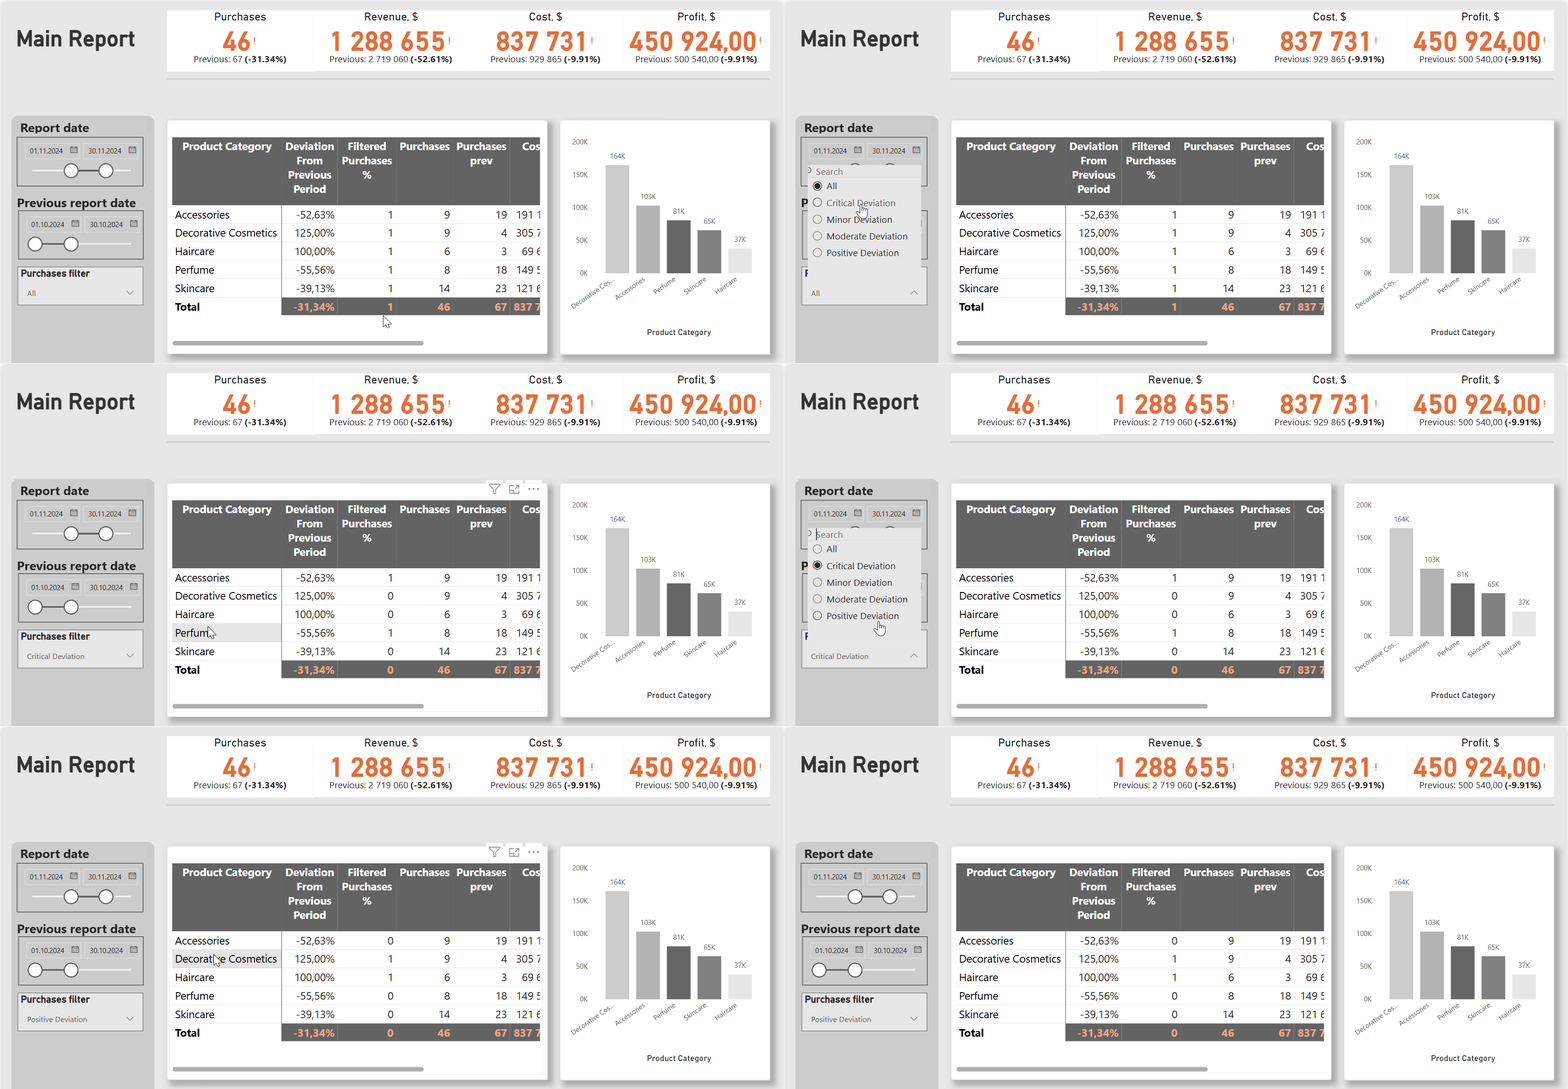
If the filter Critical Deviation is selected, a value of 1 will be assigned only to categories where Deviation From Previous Period < -40%, such as Accessories and Perfume. Positive Deviation will apply to Decorative Cosmetics and Haircare, respectively.
After verification, you can remove Filtered Purchases % from the table. However, to display only the required data from a specific segment, we need to add a condition at the table level that Filtered Purchases % is 1.

Finalizing the Table
After verification, remove all auxiliary columns and keep only the necessary metrics (such as the number of transactions, sales, expenses, etc.). This will help you create a clear and concise report for analysis.
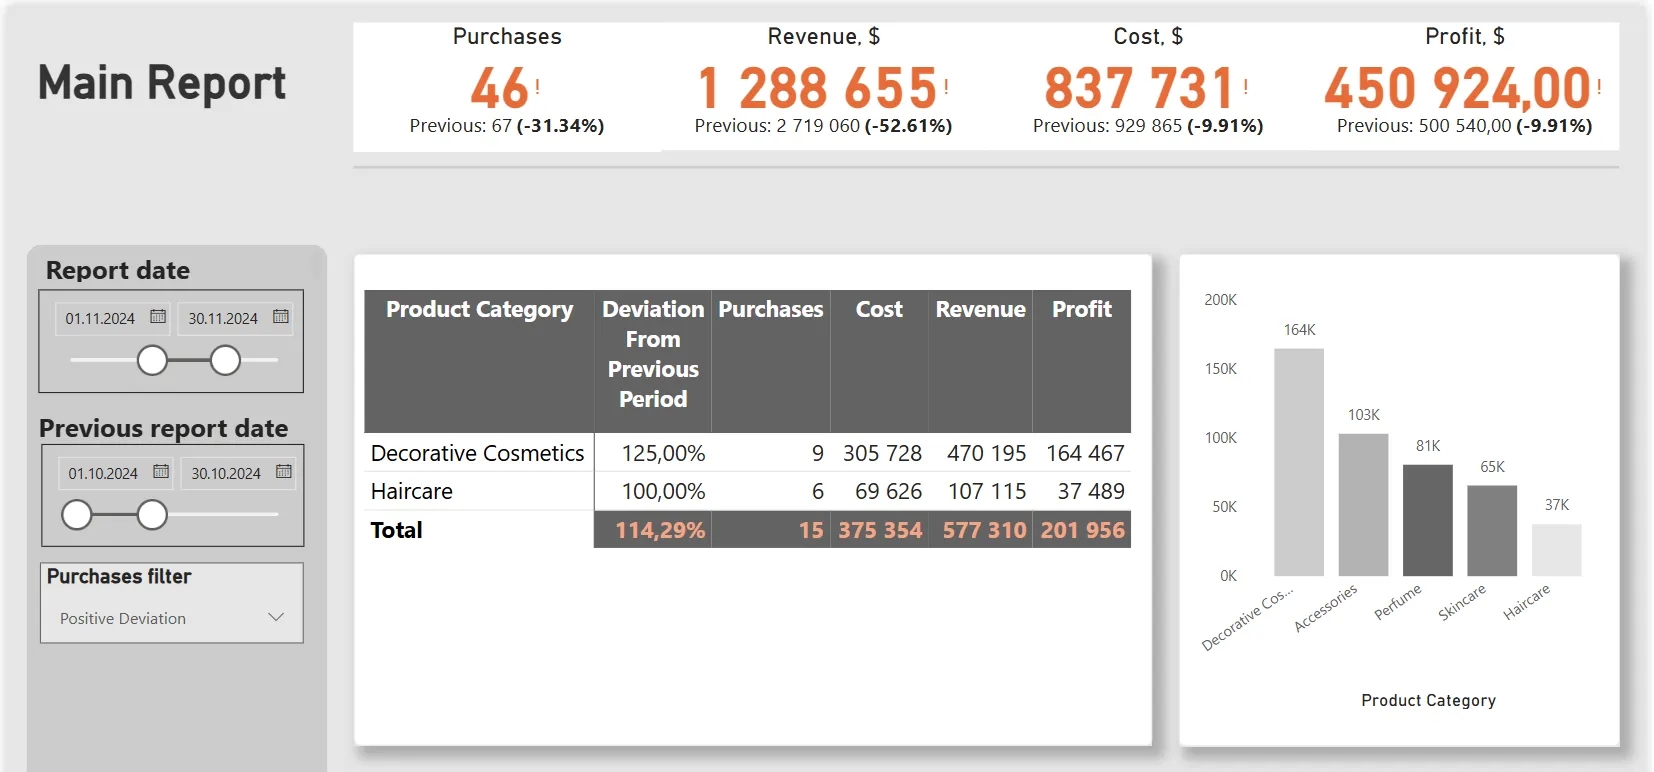
At this stage, you might logically ask: if we defined static deviation segments and used them in the filter, why do we consider them dynamic?
Despite the fact that the filter segments are static, the deviations themselves change depending on other filters, such as the traffic source. In this way, the data adapts to the selected conditions.
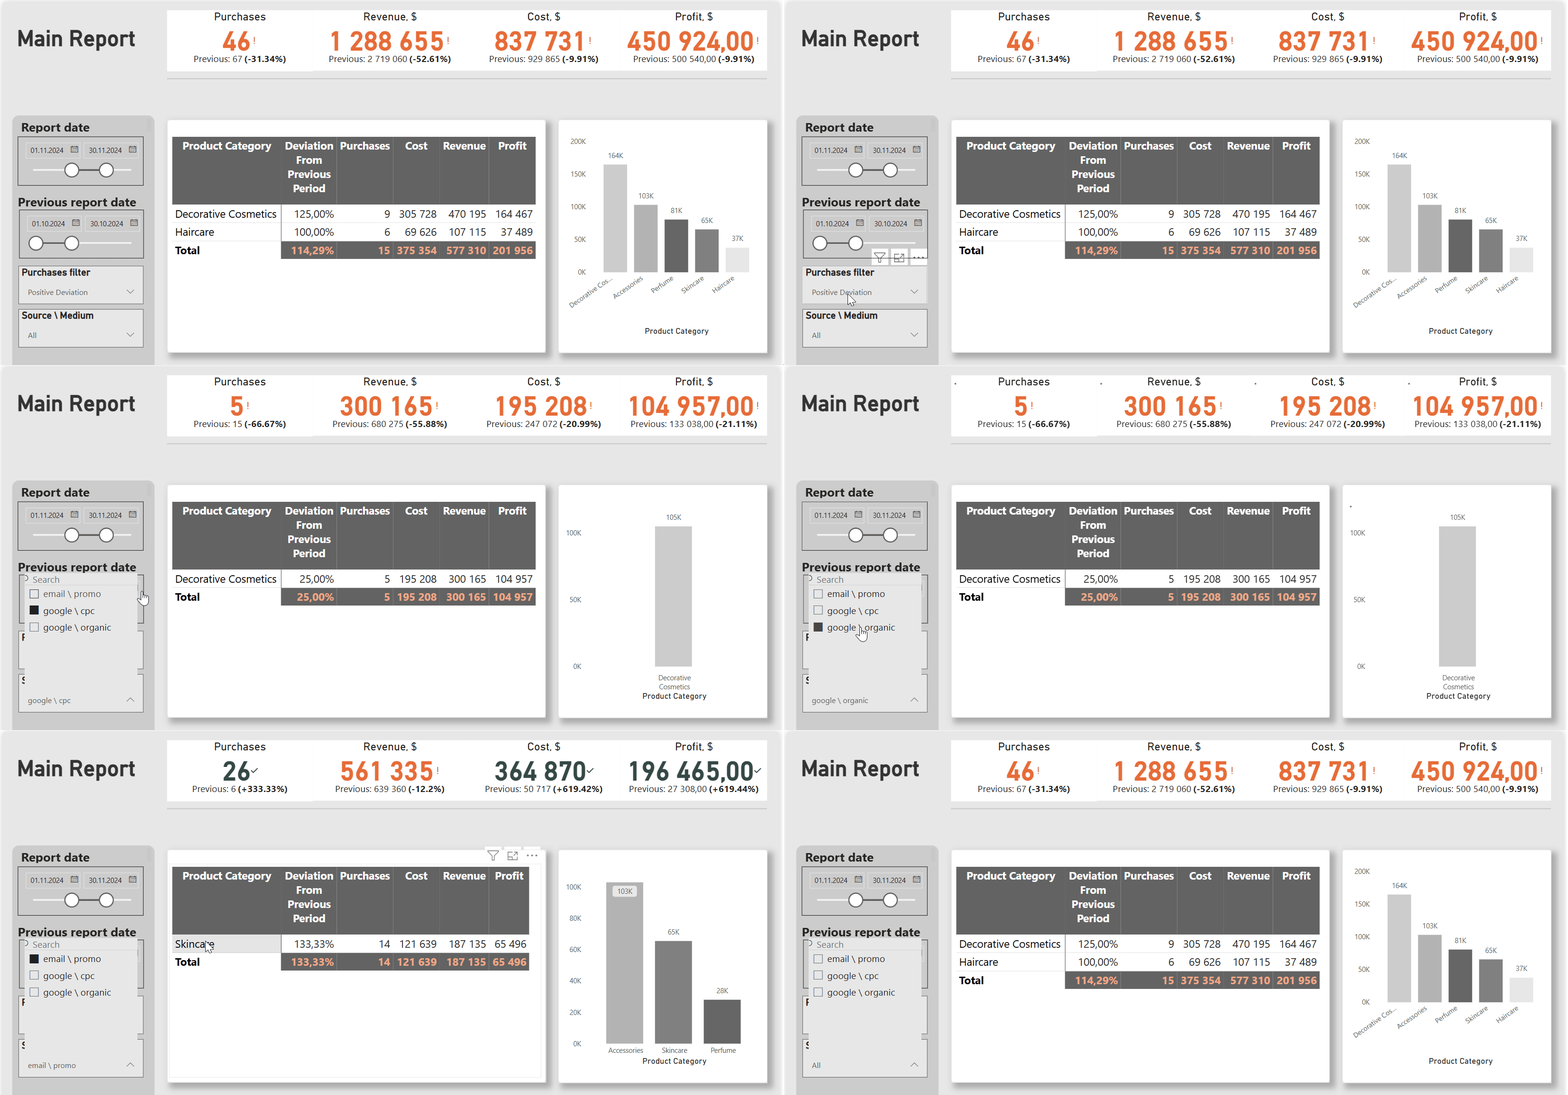
Let’s say we select google \ cpc. We can observe that for this specific traffic source, the Positive Deviation in November is only for Decorative Cosmetics, while Haircare is absent from the table under these conditions because the sales came from another source.
In this case, the predefined conditions for the segments in the filter remain static, but the deviations will change depending on the traffic source, as the number of sales varies. This is what makes the filter dynamic.
Conclusion
I hope my example of using a dynamic filter has clarified its purpose and when it can be useful. My example addresses a situation with a single measure, but similar segments can be built using two or even more measures, depending on the task.
Try adding dynamic filters to your next Power BI report, and let me know in the comments how it worked for you)
Loading comments…