Web Analytics Evolution: from ‘just looking at numbers’ to ‘making informed decisions’

This article was created thanks to real events and mistakes that beginners often make when choosing which metrics to analyze. Believe me, I know exactly what I'm talking about here: I made these mistakes myself back in the day, and with each launch of the PRO ANALYTICS course, I keep seeing confirmation that this is quite a common situation among students. To help you avoid it, I wrote this material.
On my first day working as an assistant to a digital marketer, I was given access to Google Analytics (at that time, it was still Universal Analytics). And, of course, I eagerly started exploring: who our users are, where they come from, how they behave. It was my first experience with this tool. I spent the entire weekend with it and, as I thought back then, had created the perfect portrait of our audience and the pages they were interested in. I did all of this based on the metric “Number of Users”—the more we had, the better for us (or so I thought).
On Monday morning, I came to the office and, during my small presentation, received a logical question: “Why do you think they are our target audience?” My answer, which I also thought was very logical at the time, was: “If they’re visiting our website, it means they’re interested, so that means they’re our target audience.” (Oh, rarely in my life have I been so wrong.)
That’s when it was explained to me that you can “drive” any kind of traffic to your site (and the fact that someone visits your site doesn’t mean they are actually interested in your product/service). But what businesses care about is not every user who visits the site, but only those who take the actions we need them to take. In modern GA4, we would call these actions “Key Events,” while in advertising systems, the term “conversions” is often used. This is why it’s worth looking not so much at the number of users but at the number of conversions they generate, and especially at the conversion rate.
This story happened 10 years ago, and now, looking back with the experience I’ve gained, I can say it was only the beginning. Later, I developed a “growth path” framework that I want to share with you. It will help you understand what to look at in web analytics in general, and in GA4 specifically, so you don’t get stuck on surface-level metrics.
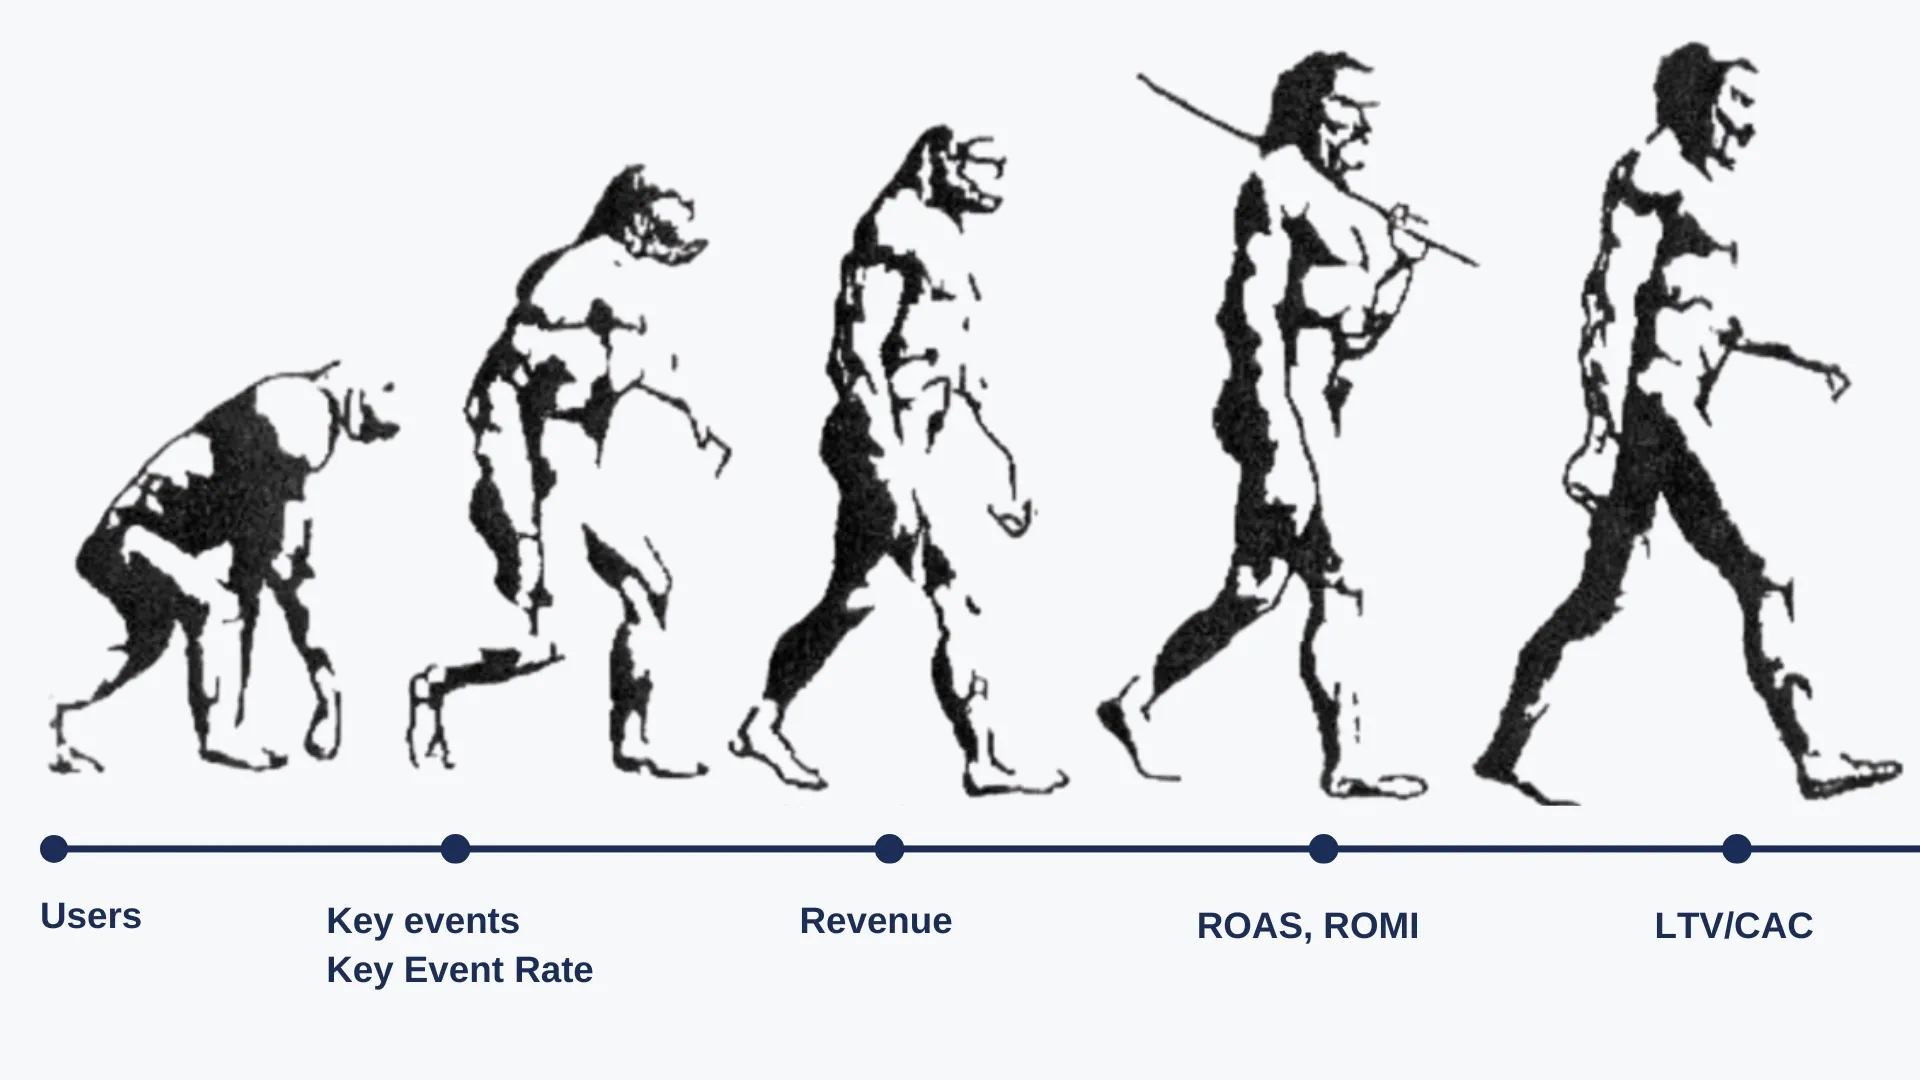
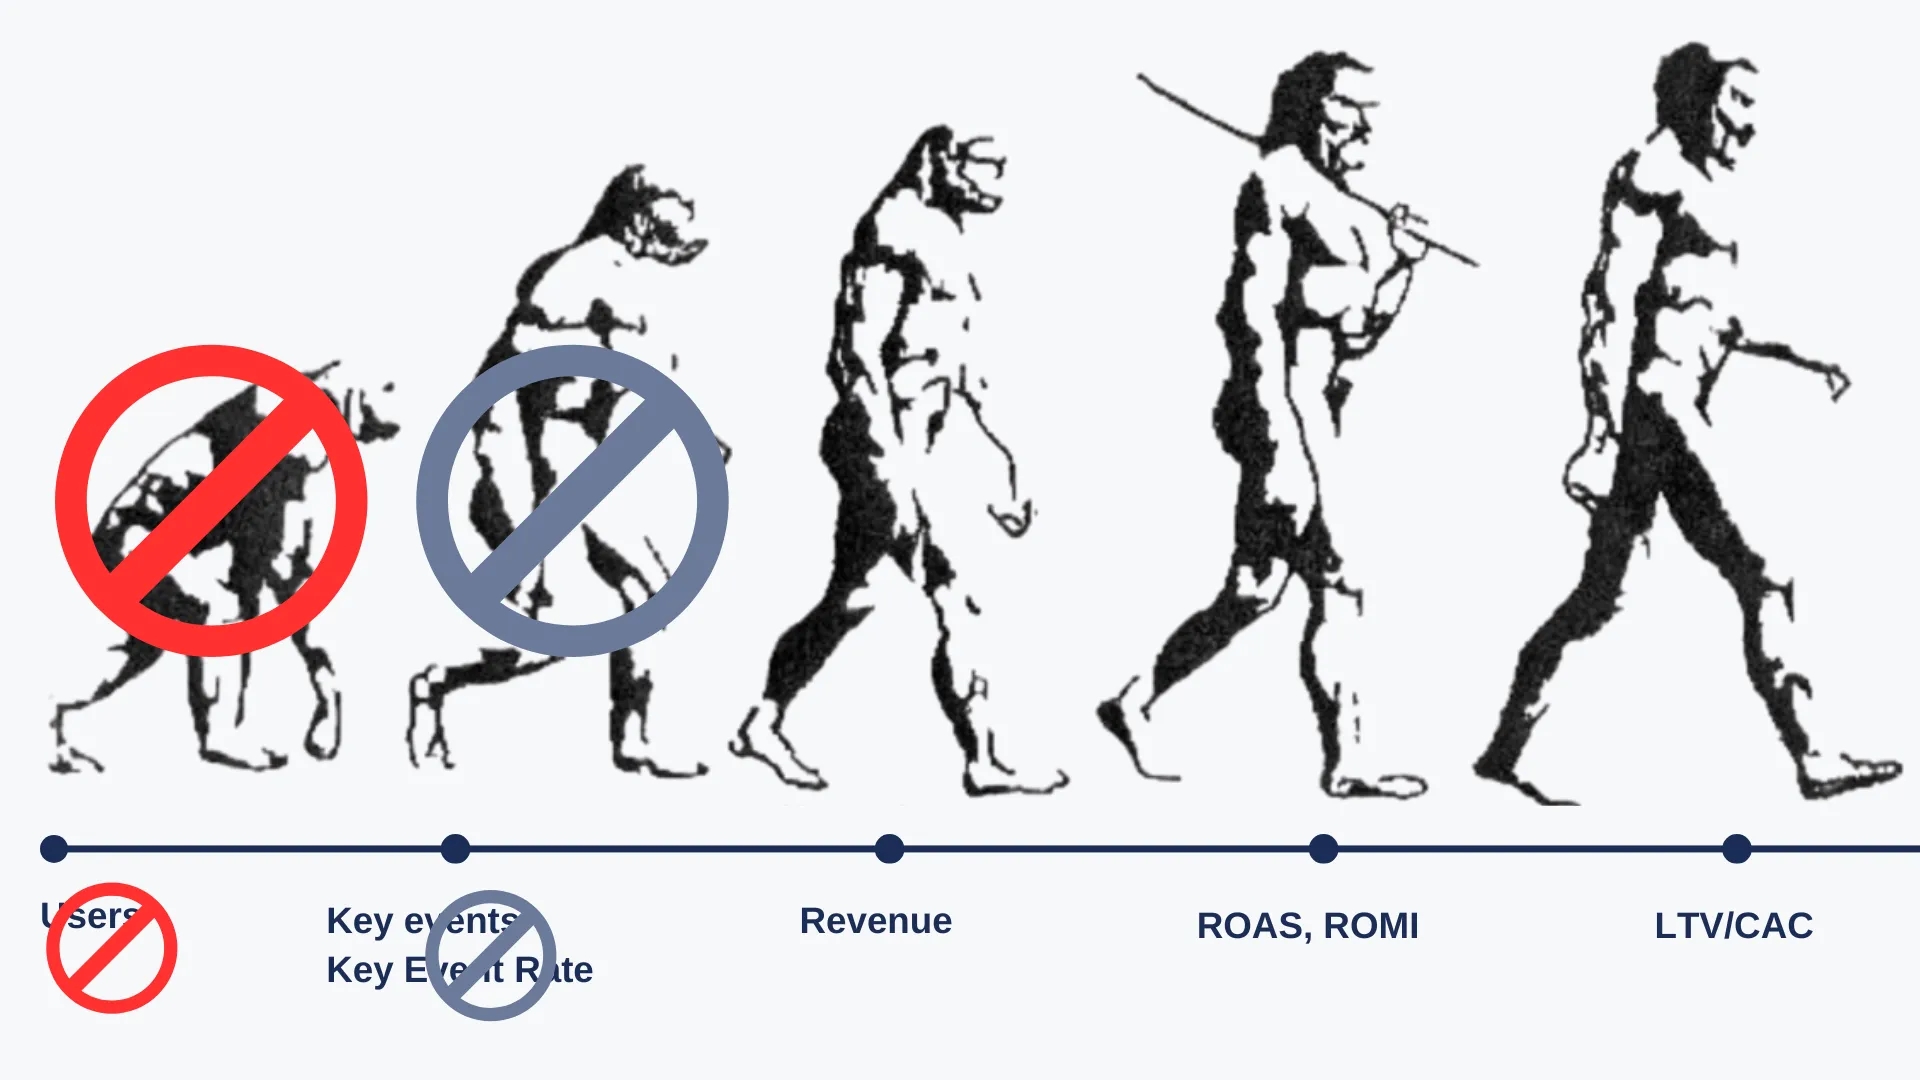
The picture below captures the short essence of this material. You can read the full version of my thoughts further down.
Although GA4’s interface technically has both key events and conversion data imported from your ad account, in this material, I will use the terms “key events” and “conversions” interchangeably, meaning important user actions on our website, such as purchases.
In this material, I also mention the “conversion rate” metric, referring to the ratio of the number of conversions to the amount of traffic. Of course, I fully understand that the phrase “the ratio of the number of conversions to the amount of traffic” is quite vague. For example, even in Google Analytics 4, there are at least two metrics that show this: “Session key event rate” and “User key event rate.” However, since the purpose of this material is to convey high-level ideas, I will simply clarify that each of these metrics has its own nuances and use cases depending on the situation.
Stage 1. Where to start and what to aim for in web analytics
As we’ve already established in the introduction, user count isn’t a metric worth much of your attention. (Even if you’re a content site that sees traffic as your main priority, I still believe you should focus not on all users but at least on those who engaged with your content, and ideally, those who returned to your site.) The starting point is, at the very least, the conversion rate paired with the number of conversions. But this is just a starting point, and only because this set of metrics is accessible to any business.
If you already know your starting point, then what’s at the finish line? In my opinion, at the finish line is the ratio of LTV (Lifetime Value—the projected total revenue a client will generate for us) to CAC (Customer Acquisition Cost—the cost of acquiring that client). It’s quite logical: if I receive more revenue from a client than I spent to acquire them, that means everything is fine, and my business is moving in the right direction. If the situation is the opposite, then something is going wrong.
You see, it’s very simple — analyze just two metrics, and you’ll know where your marketing is heading. So why do most businesses still not use this approach? The reason is simple: in practice, it’s not that easy to calculate these metrics. Sometimes, setting up this kind of analytics can cost more than several months’ worth of your marketing department’s budget.
So, while the LTV/CAC ratio is what you should aim for, depending on your business’s stage of development, on your way to this ratio, you will need to make decisions based on other metrics that will be available to you at that time.
These are the metrics we’ll talk about next, along with your path to better analytics. And, of course, in a much more practical approach.
Stage 2: The minimum start — conversion analytics
Basic analytics starts with conversions (or Key events if we’re using GA4 terminology) — actions that bring value specifically to your business: purchases, form submissions, subscriptions, or other important user actions on your website. In GA4, you select these events yourself from the list of all events being tracked.
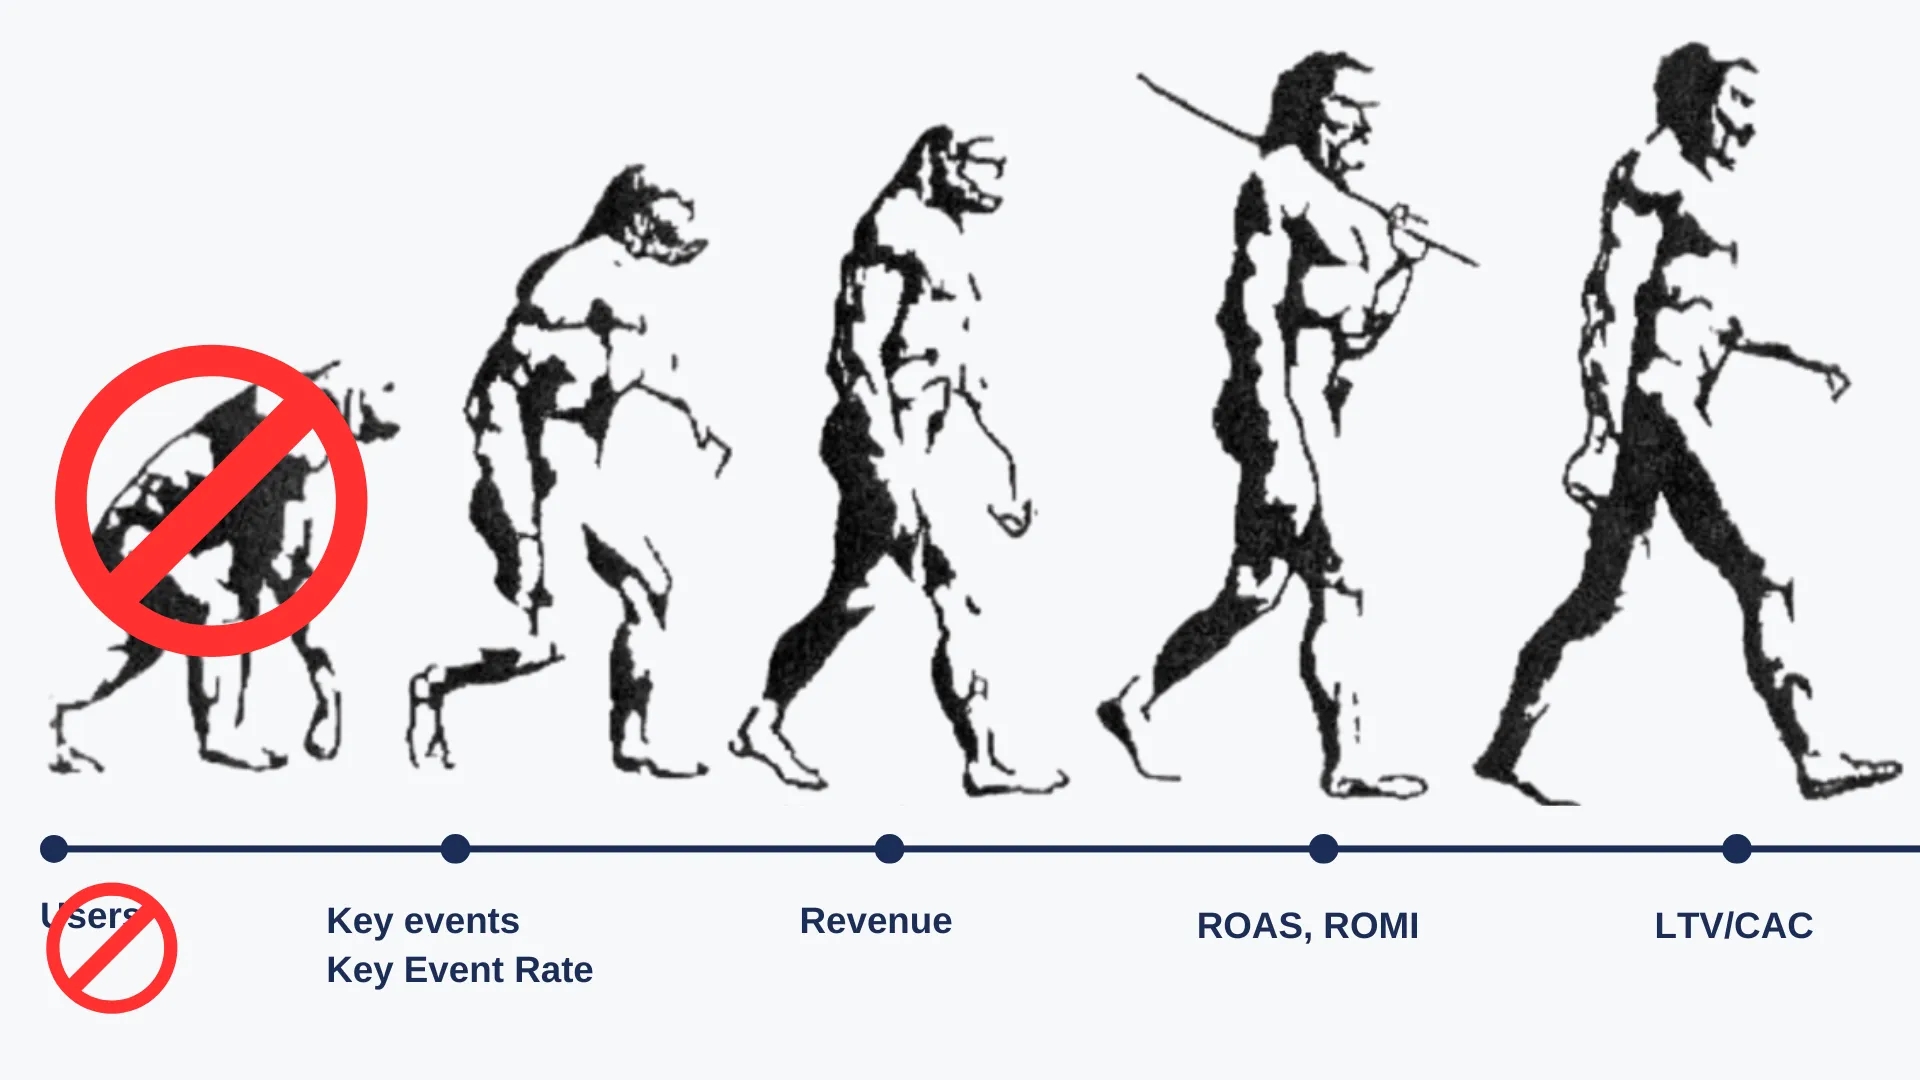
Knowing how many valuable actions were completed is already a good start. But it’s even better to know the answer to the question: “How many conversions will I get if 100 people visit my website?” This provides true analytical value, shows how effectively your site or campaign is driving the audience to take the actions you need, and most importantly, helps you make managerial decisions.
As I mentioned earlier, GA4 has two metrics that show this:
- User key event rate — shows the percentage of users who visited your site and completed at least one key event.
- Session key event rate — shows the percentage of sessions in which at least one key event occurred.
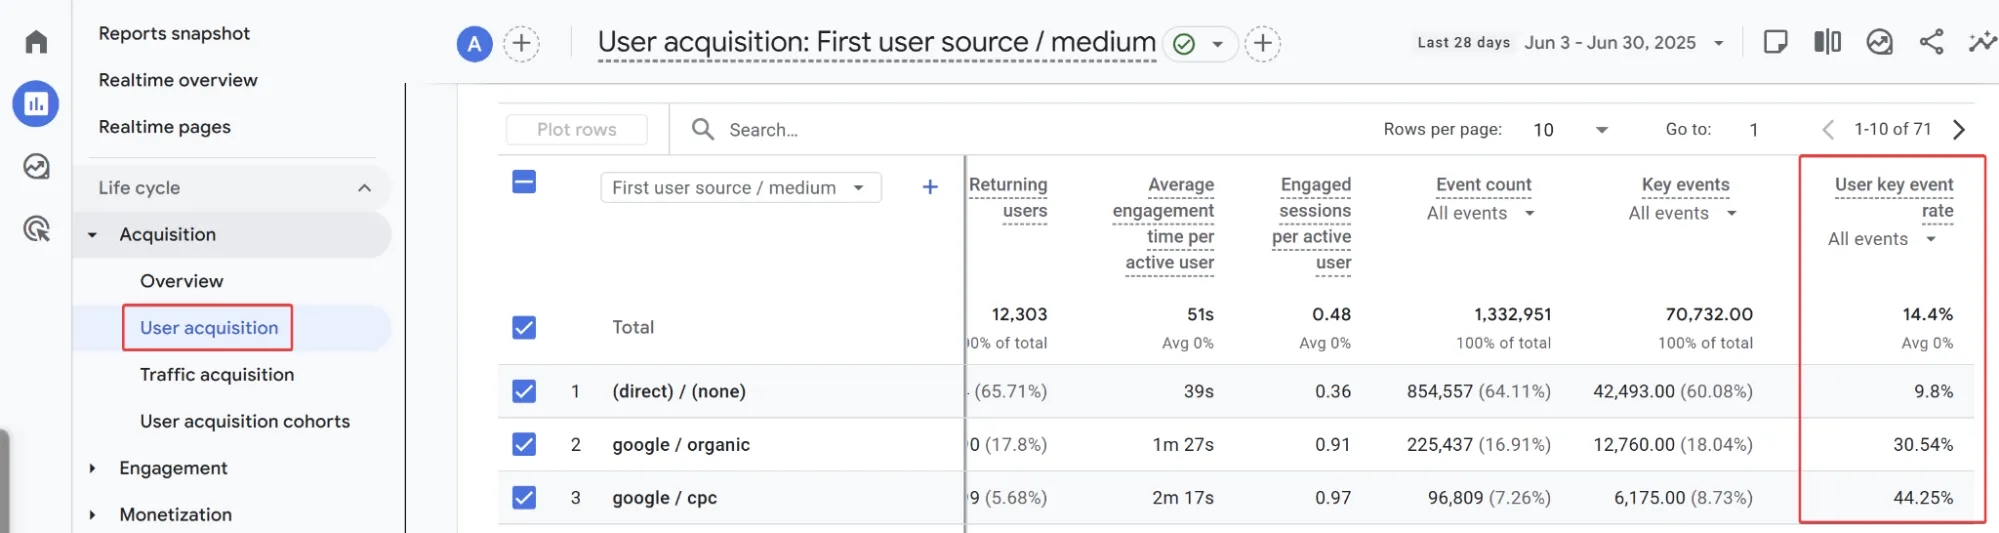
Choosing between them depends on what exactly you want to understand: user engagement or the effectiveness of your traffic sources. In the modern web analytics world, we typically analyze users, which is why in most GA4 reports, you will find the User key event rate. For example, it appears in the Demographic details report (to help you better understand the demographics of your target audience), Tech details (to analyze the technical data of the devices your audience uses to visit your site), and User acquisition (to see which sources are bringing in new audiences who go on to take the actions your business needs).
The Session key event rate is currently available in only one standard report—Traffic acquisition. There, you can analyze which traffic sources convert better into your target actions.
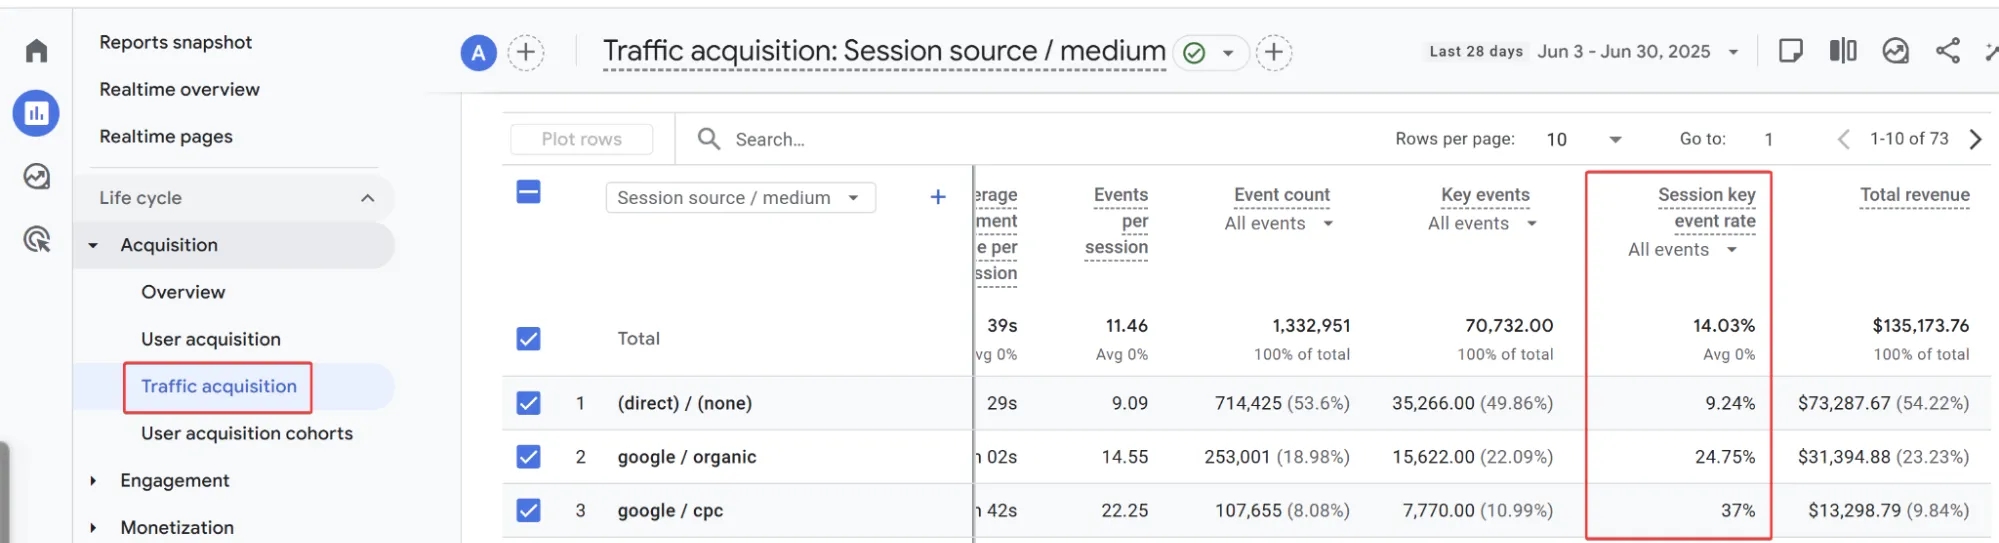
Stage 3: Revenue analysis
Having conversions set up and analyzing the conversion rate is something that absolutely every business should have in place. However, the mere fact of a conversion is not yet an indicator of success. A purchase or a completed form is good, but we should not forget that the main goal of a business is revenue. Therefore, the true benchmark of effectiveness should be the revenue you receive from the audience you have attracted.
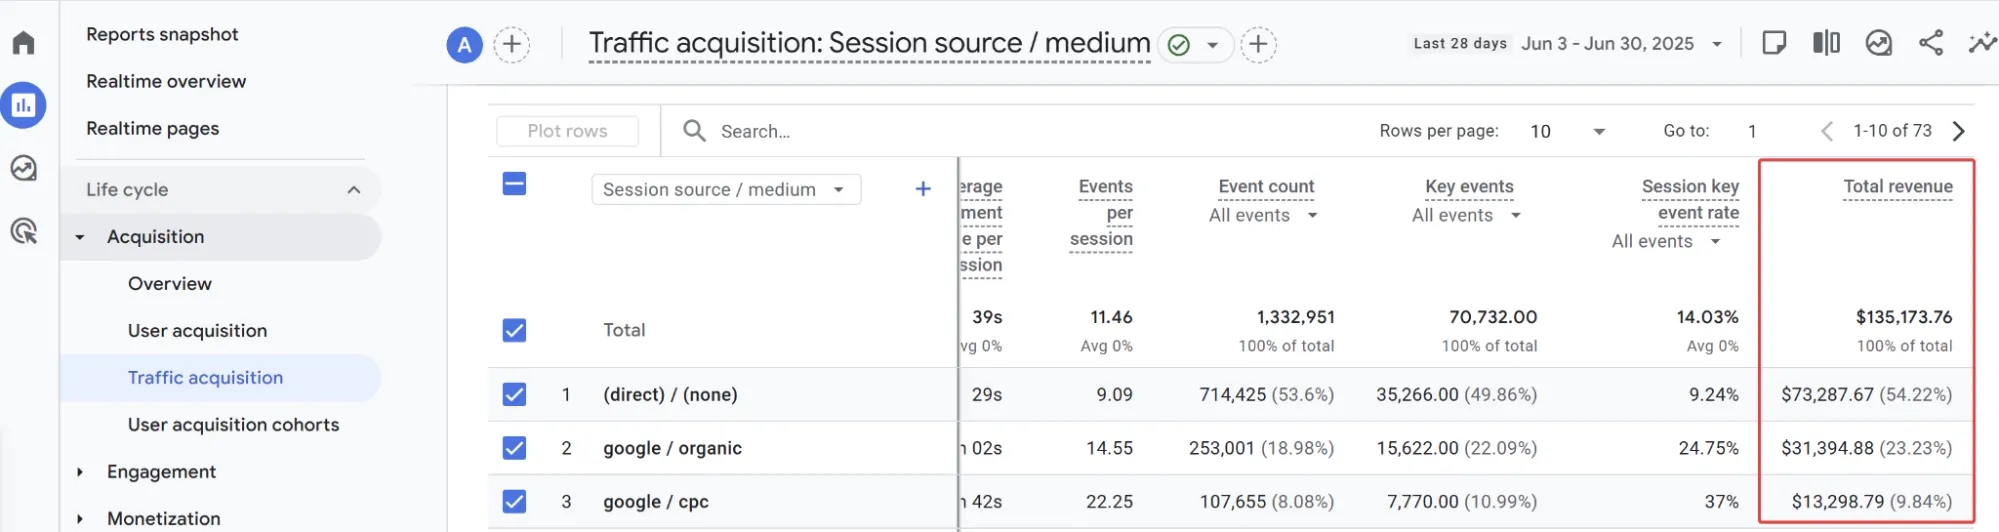
In GA4, there is the Total Revenue metric for this, which is available in most standard reports.
You can also import this metric’s data into your ad accounts and use it to train your ad campaigns, which usually has a positive impact on their effectiveness.
Most players in the ecommerce market fully understand everything described above, which is why setting up conversions and ecommerce in GA4 is something that most companies already have in place.
But if we look at other types of websites, for example, service-based websites, the situation is different: revenue in GA4 is rarely found there because you can’t simply pass it from a thank-you page. At that moment, we don’t know it yet. And this is where the first challenges appear, stopping businesses from moving to this stage.
However, these are steps you definitely need to take. Whether you set up revenue data transfer from your CRM via Measurement Protocol or use the option to work with raw data in BigQuery — the choice is yours. But if you want to make the right decisions, you absolutely need to know which audience segments and which advertising activities are generating real revenue for you.
Stage 4: Calculating ROAS and ROMI
While revenue is an important metric, it is an absolute value and doesn’t say much on its own.
Imagine this: you see a revenue of $10,000 — it looks great. But if it took $15,000 in ad spend to generate it, would you be happy with that result? And what if it’s the opposite — you spent only $1000 and earned $5,000?
That’s why in analytics, it’s important to evaluate not just how much you earned, but whether this revenue justifies your advertising investments. This rule applies to everyone—whether you are generating leads or selling products. The focus should not just be on the volume of revenue, but on its profitability.
This is where ROAS (Return on Ad Spend) and its counterpart ROMI come into play — metrics that help you understand how many units of revenue you receive for each unit of advertising (or marketing) spend.

Note that I keep adding the human evolution diagram for a reason: it’s not just about moving to the next step. Take a closer look at this diagram—everything before the Neanderthal represents the “dark era.” It was only the Neanderthals who began using abstract thinking, allowing them to develop further, make more complex decisions, and evolve to the point where we, as modern humans, appeared. They were the ones who, for example, began to control fire. Of course, the first uses of fire appeared with Homo erectus, but those were mostly accidental or involved using naturally occurring fire.

Studying history is a hobby of mine, so I could write a lot more here, but here’s the main point I want to convey: of course, you can continue to hope that you will be able to make the right business decisions without proper analytics, just as Homo erectus hoped to find fire by chance, but it’s much better to know how to create it yourself. Of course, this is not the final stage of development, but it’s what I recommend everyone should have.
Analyzing the conversion rate is the bare minimum that everyone already has, while analyzing ROAS (ROMI) is what I consider my personal minimum that I recommend you aim to reach.
By the way, you can find this data in the GA4 interface, for example, for Google Ads campaigns, here:
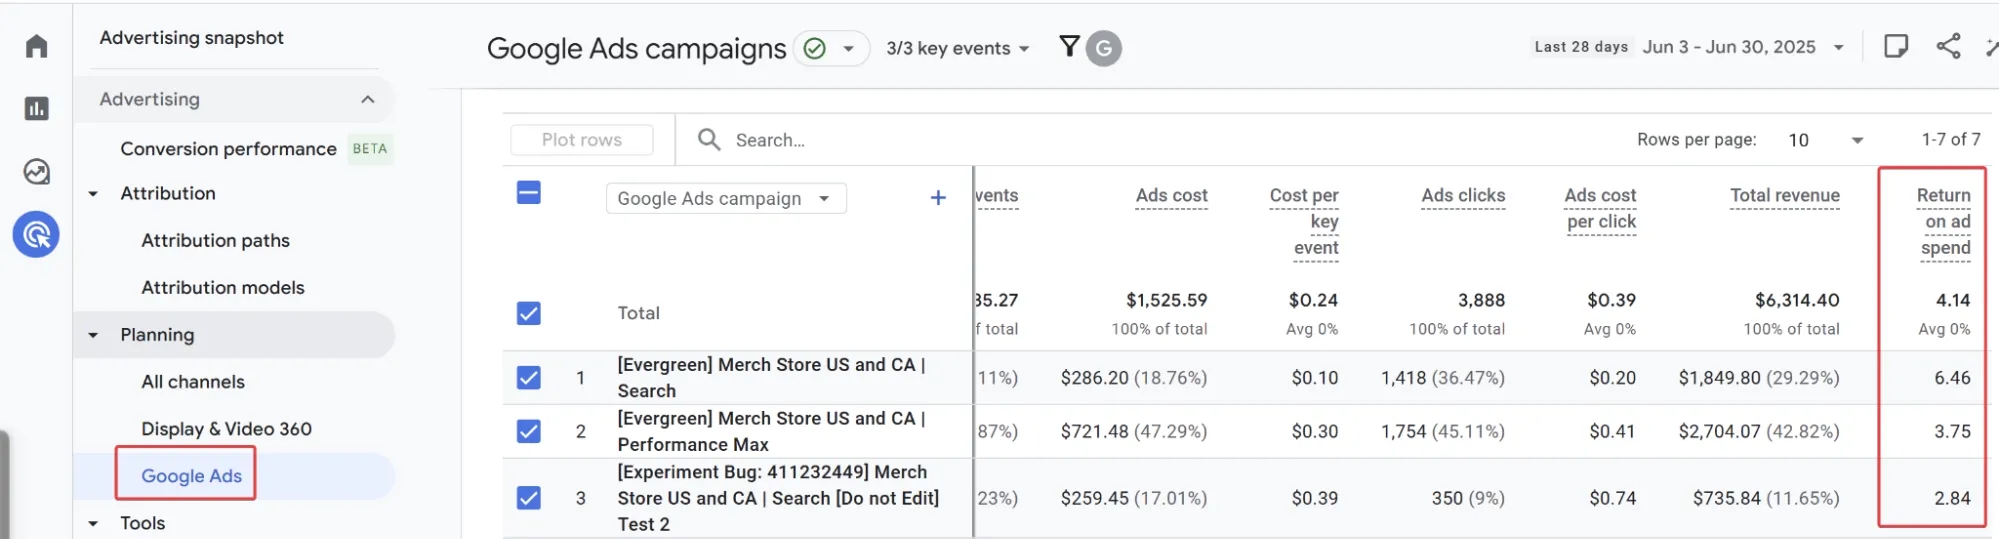
To get data for other traffic acquisition channels, you may need to set up ad spend import into GA4.
Stage 5: Working with LTV and CAC
At the previous stage, some businesses might already decide to stop, but there are cases where ROAS may be low or even negative—and this doesn’t necessarily mean the company is performing poorly. Often, acquiring new customers requires significant expenses that may not be covered by the first, second, or even fifth payment. However, if the customer stays with the brand long-term and makes repeat purchases, the investment gradually pays off. And this is where LTV comes into play.

LTV (Lifetime Value) shows how much money we expect to receive from a single customer over the entire duration of their relationship with the business. Yes, calculating it requires more complex formulas, but LTV helps us understand whether we are attracting a “valuable” audience.
To evaluate how justified the customer acquisition expenses are, LTV is always compared with CAC (Customer Acquisition Cost).
- If LTV > CAC, the business model works, and we earn more than we spend.
- If LTV < CAC, it signals that the business is losing money on each user, and it’s time to revisit the acquisition or monetization strategy.
In summary, if we reduce web analytics to a single comparison, everything revolves around the pair: revenue and costs. More precisely, the ratio of one to the other.
At this stage, a logical question may arise: “If we have these two metrics, why does GA4 offer dozens of others?”
The answer is simple: details matter. These metrics will give you the big picture, and if you’re not satisfied with that picture, it makes sense to dig deeper.
– Why does one channel have a higher conversion rate?
– Where are users “dropping off” on the path to conversion?
– At what stage does efficiency decline?
This is where additional metrics come into play: engagement metrics, scroll depth, average pages per session, time on site, and others.
They aren’t always needed at the start, but they become critically important when you want to dig deeper to understand exactly what needs to be optimized.
Conclusion
Web analytics is not about numbers for the sake of numbers. It’s a tool for making informed business decisions.
This “analytics evolution” we’ve discussed is the path everyone takes when they want to learn how to work with data consciously.
Of course, just like human evolution, this journey is much more complex than it’s usually portrayed.

I once went through it myself (while working as a marketer, and it was after this that I moved into web analytics), and you can too. Take a look at which stage you’re currently at and where it makes sense to go next.
Loading comments…