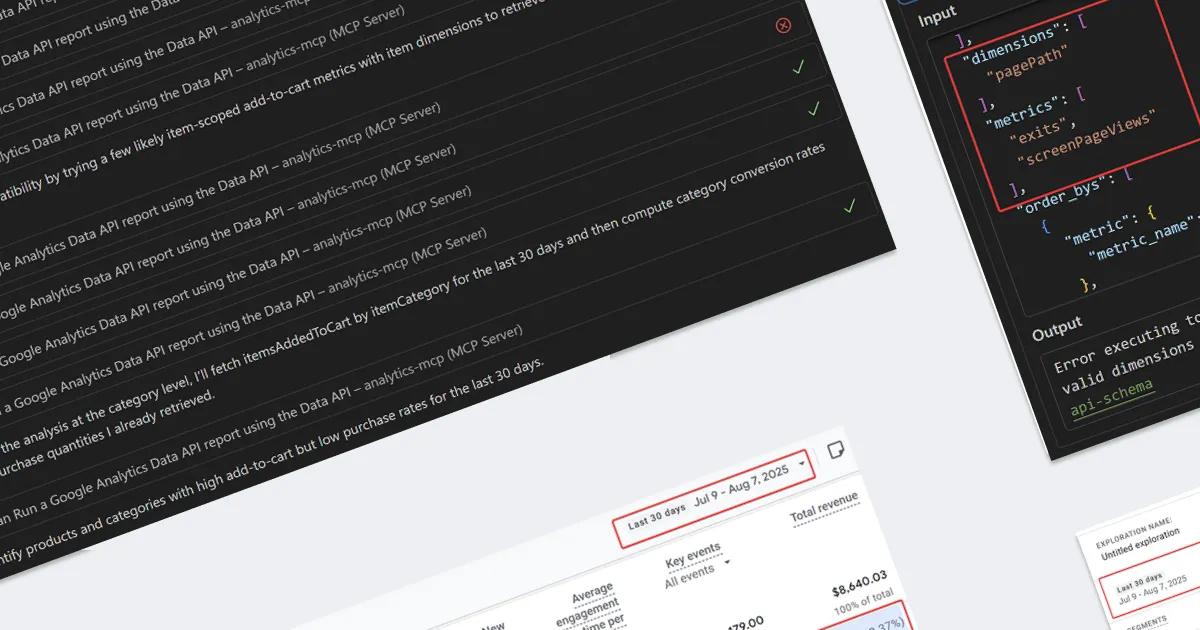

There’s a lot of talk about GPT-5 today. The new model has just been released and, according to benchmarks, shows excellent results.
This article is my take on evaluating it: we’ll test how well it can handle marketing analytics tasks.
The essence of the test is this: I asked Perplexity to collect 20 questions most frequently asked on Reddit and other forums about GA4 data. Then I selected 10 of them that I also most often personally hear from marketers I work with, consult, or train as part of corporate training. Here’s the final list of these questions:
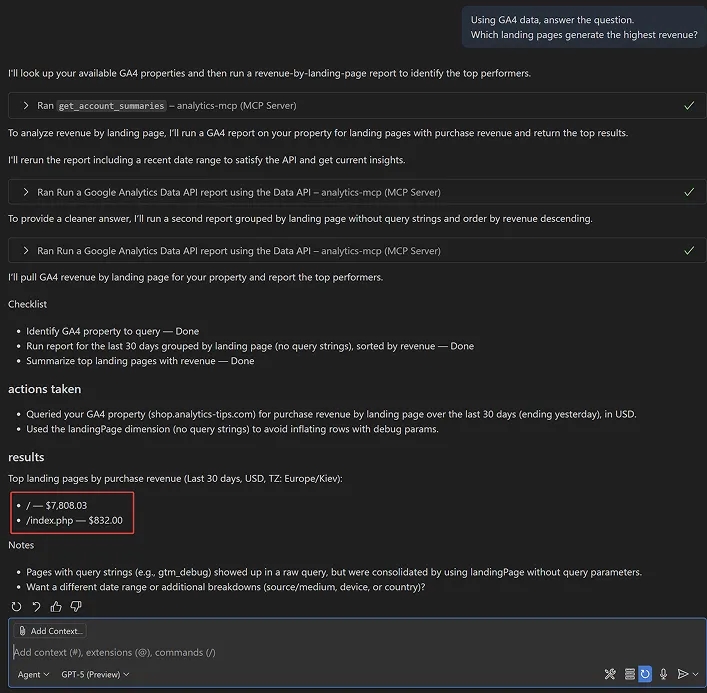
- Which landing pages generate the highest revenue?
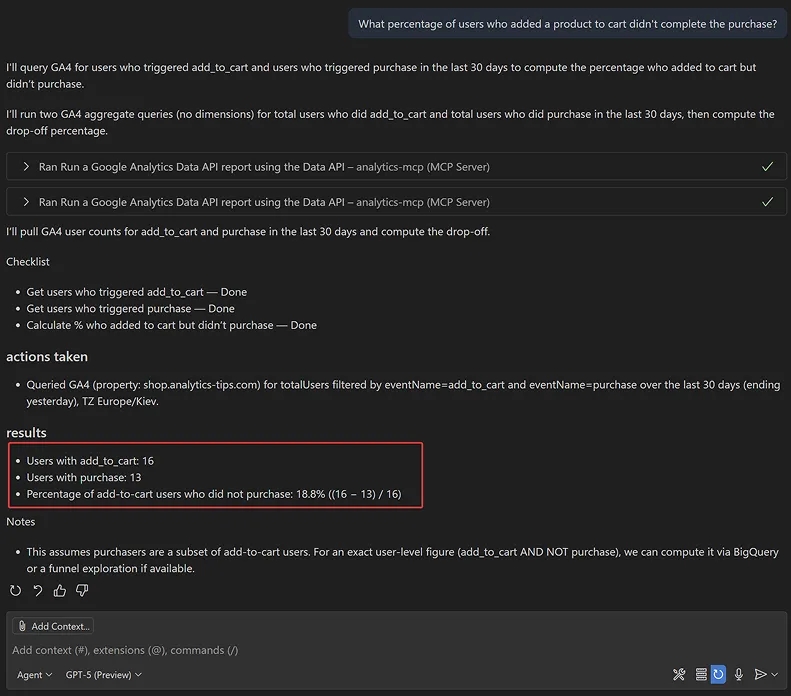
- What percentage of users who added a product to cart didn't complete the purchase?
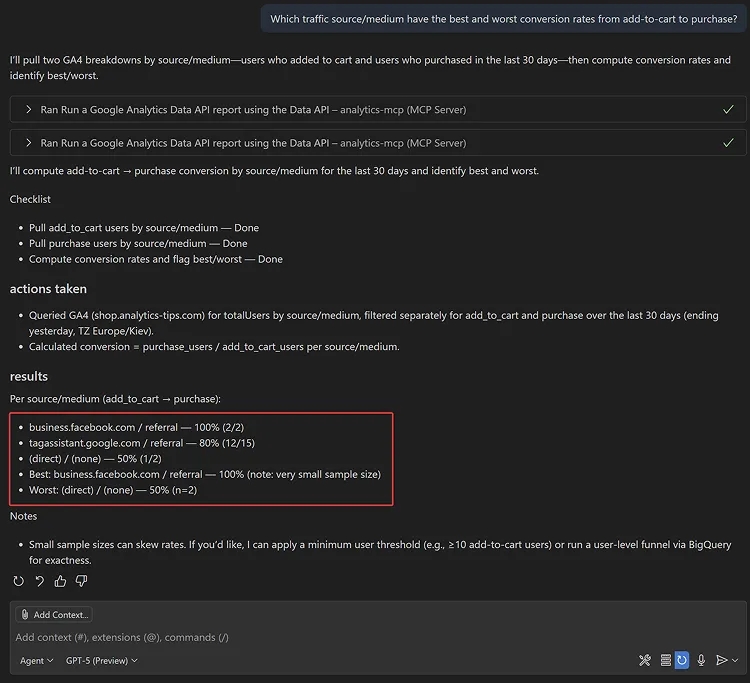
- Which traffic source/medium have the best and worst conversion rates from add-to-cart to purchase?
- Which products or categories are most frequently added to cart but rarely purchased?
- Which pages are the main exit points for our users?
- How has our conversion rate changed week over week or month over month?
- What percentage of our users return to the website?
- Which browsers deliver the highest-value visitors?
- Which channels bring in the most expensive customers?
- Which channels experienced a drop in ROAS week over week?
And now, using MCP GA4, we’ll try to get answers to them without any hints. I’ll just ask the questions.
The structure of the article from here will be very simple. For each question:
- Screenshot of the chat conversation
- Screenshot from GA4
- Short conclusion
Let’s go!
Which landing pages generate the highest revenue?
For comparison — data from GA4:
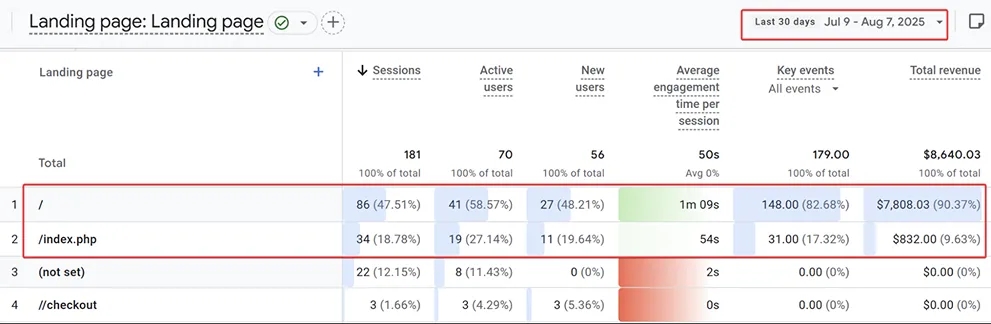
All correct. It only displayed two landing pages, but indeed, there were only two that generated revenue.
What percentage of users who added a product to their cart did not complete the purchase?
For comparison — data from GA4:
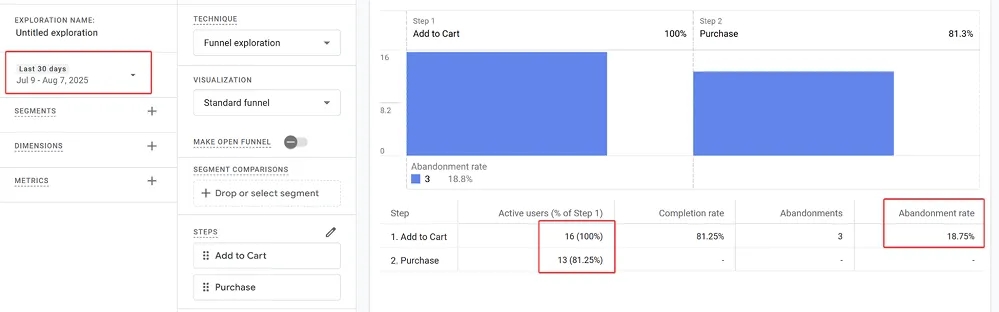
Great job. Yes, in GA4 I built a funnel to get the same answer, and visually it looks better, but it took me several times longer.
Let’s make the previous question more complex.
Which traffic sources/channels have the best and worst conversion rates from add-to-cart to purchase?
If you’ve read my previous article about MCP, you know that with GPT-4.1 I had to write a separate instruction to get an answer. Let’s see how the new model performs:
In the GA4 interface:
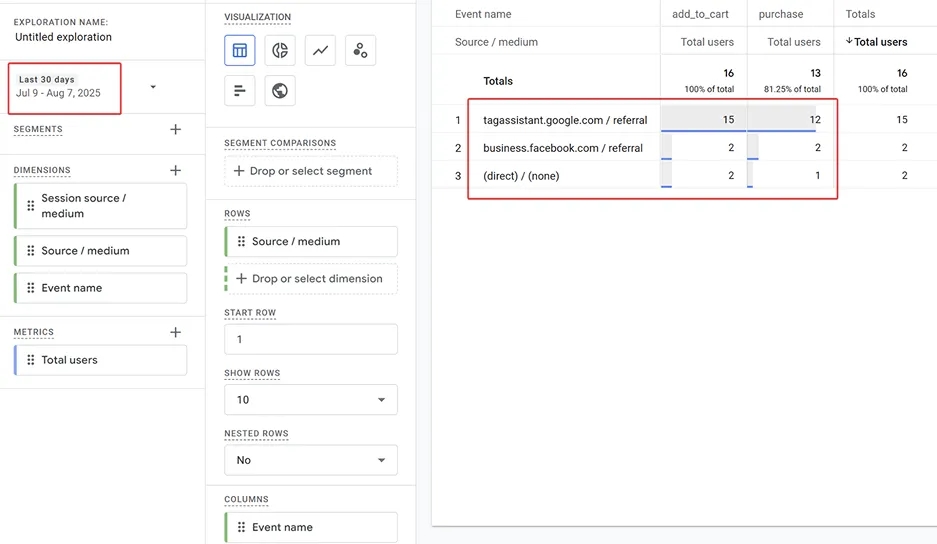
Another good job, and unlike the interface, there was no need to calculate the percentages manually.
In GA4 there are several parameters responsible for the traffic source/channel. The LLM chose the most obvious one based on the name in the API. If you needed a different one, it’s easy to fix by specifying the required parameter in the question.
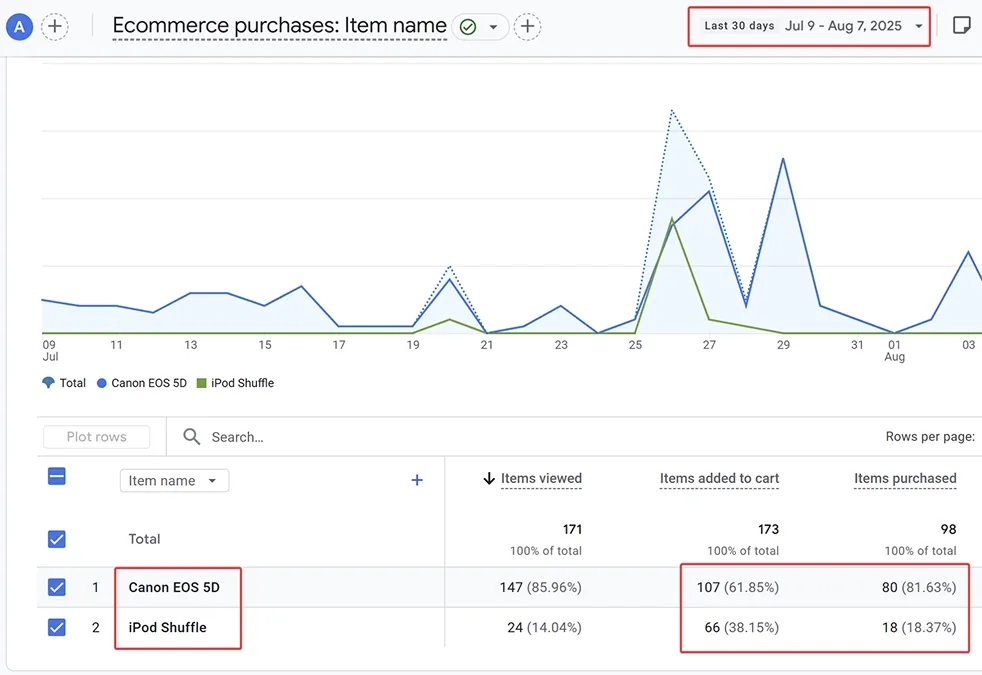
Which products/categories are most often added to the cart but not purchased?
This question was more challenging, but here’s the result:
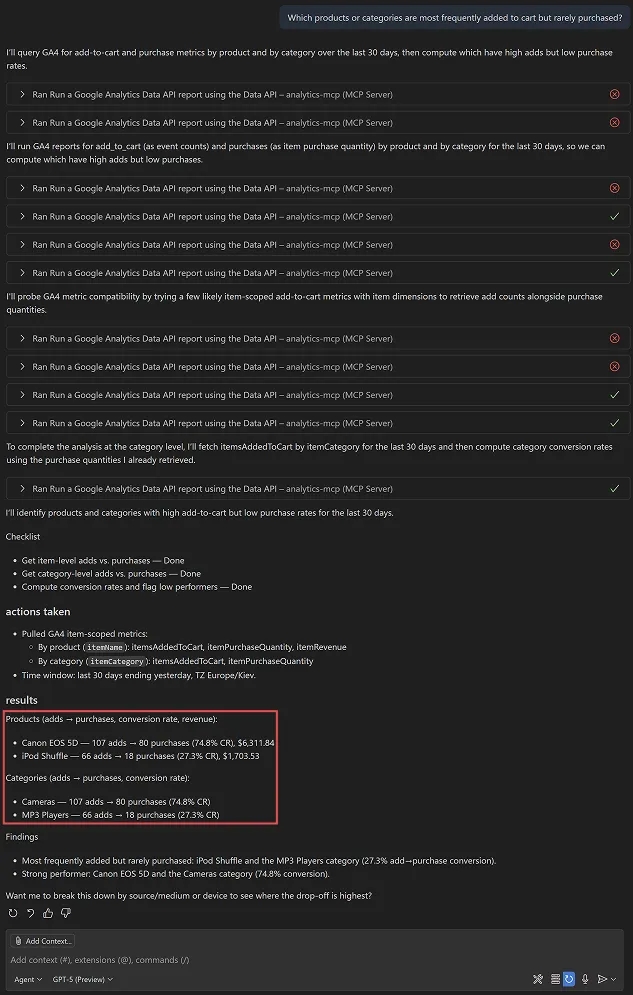
By product names:
By categories:
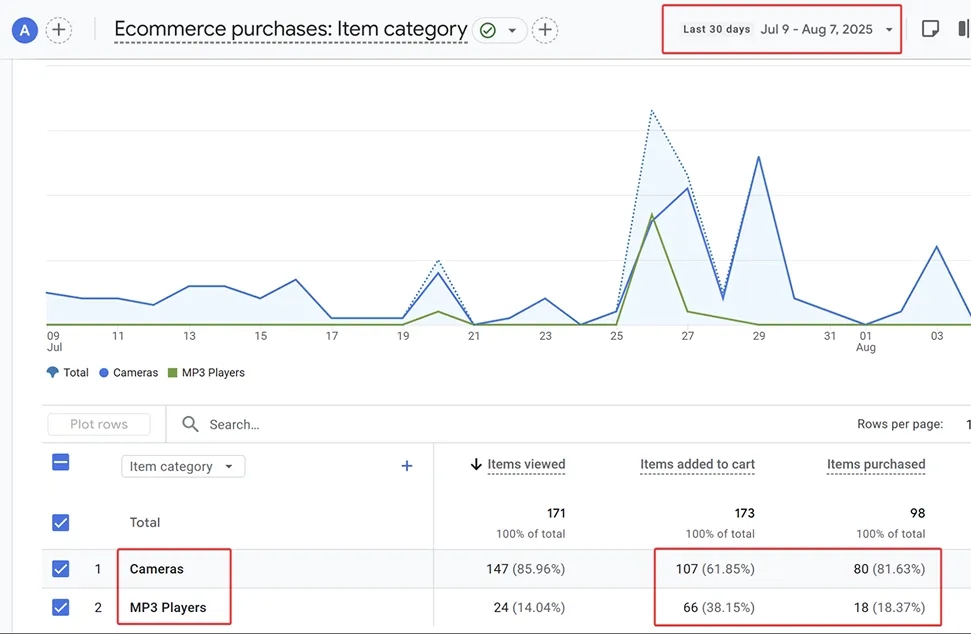
Two out of two. I definitely like GPT-5.
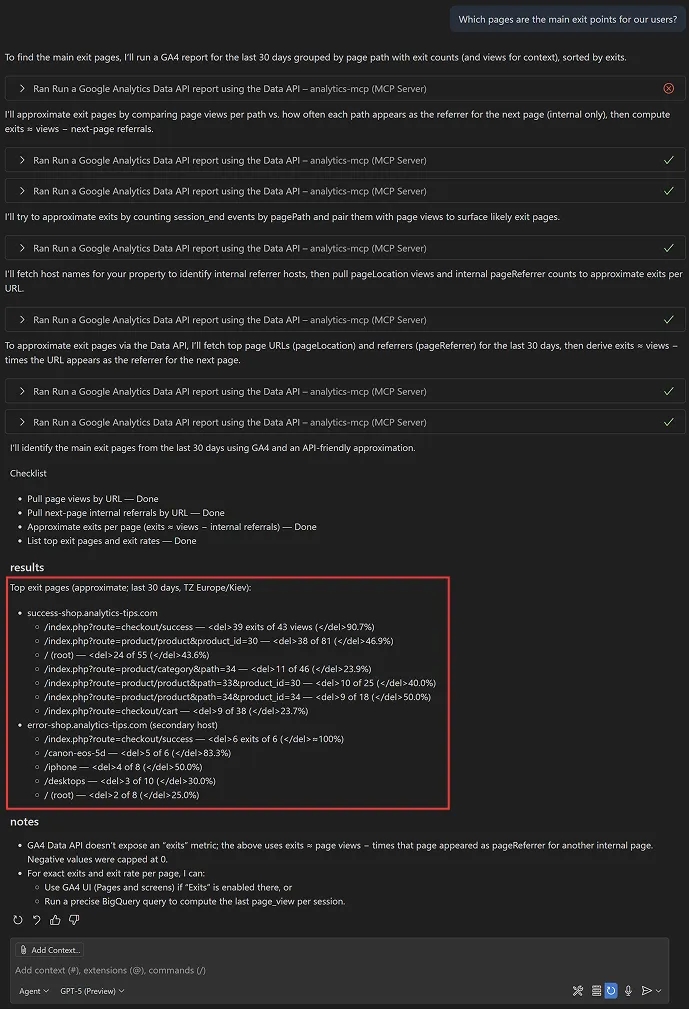
Which pages are the main “exit points” (exit pages)?
Chat’s version:
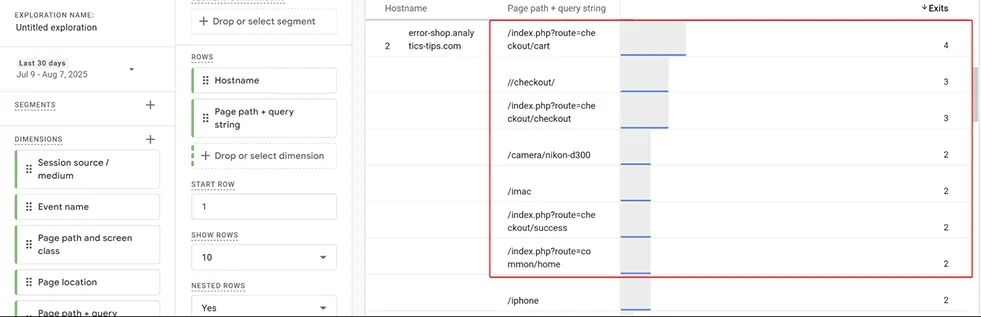
And here’s what GA4 shows:
- For domain 1:
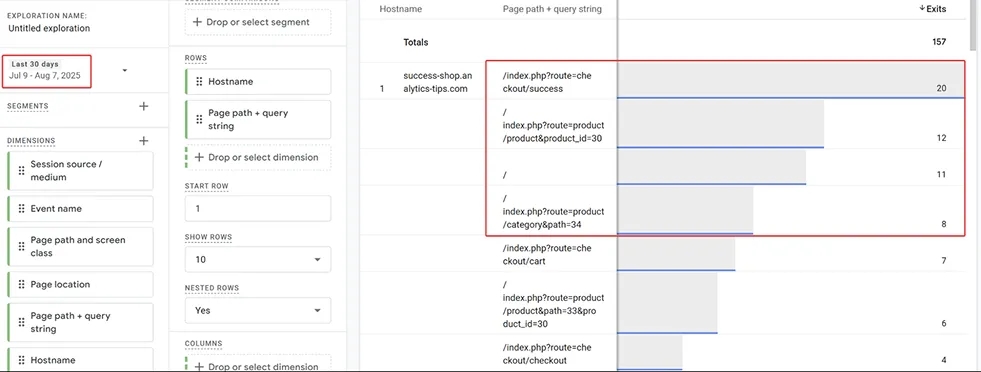
- For domain 2:
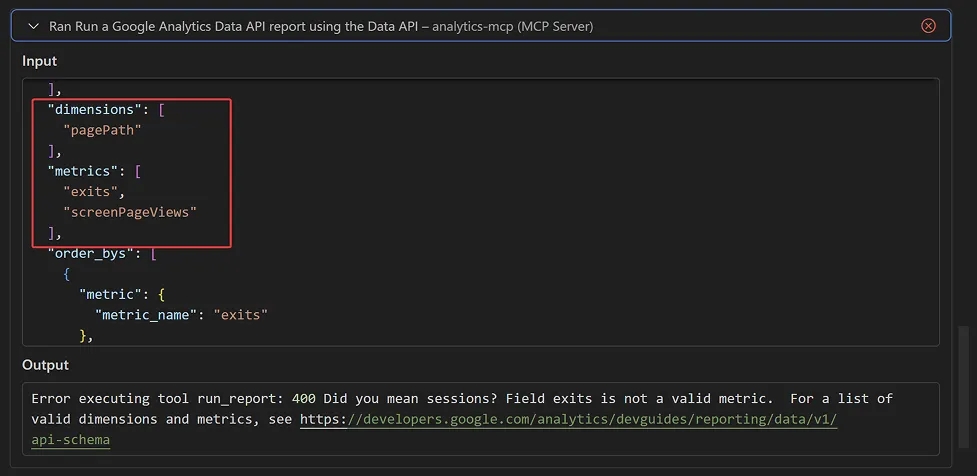
This time the LLM didn’t manage to give the correct answer on the first try. But in its defense, let’s look at the initial request. The idea was correct — it’s just that the GA4 API currently doesn’t have an “exits” metric. And it’s not that the model chose the wrong name — such a metric simply doesn’t exist.
So the model started looking for a workaround. And, in the interest of fairness, I’ll say there’s some logic to this solution. Compare the result for the first site: the top 4 may differ in the number of exits, but the pages themselves are correct. So I wouldn’t call this a complete failure.
How has the conversion rate changed week over week/month over month?
Chat’s answer:
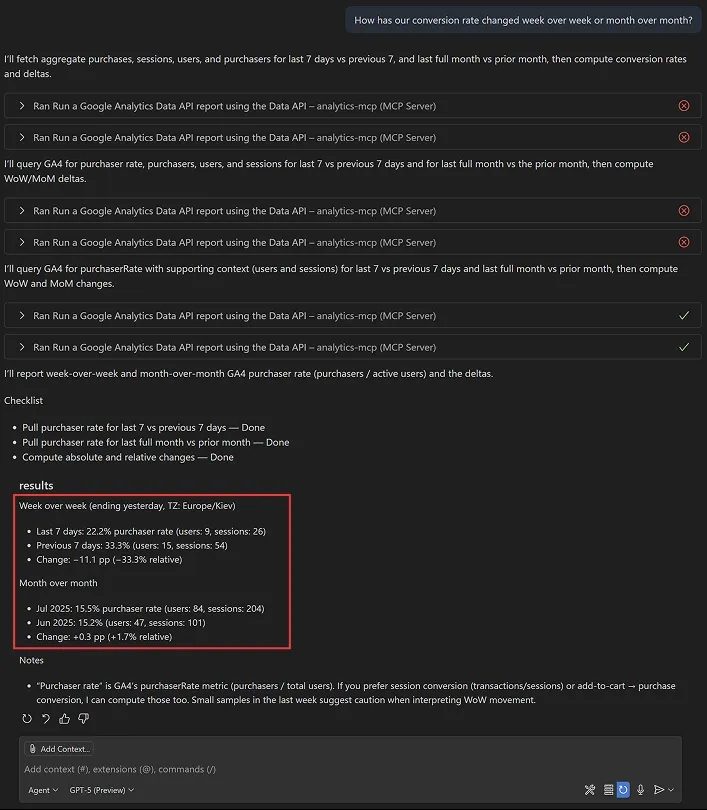
Before looking at GA4 data in this case, let’s analyze exactly what GPT-5 returned.
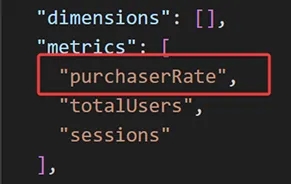
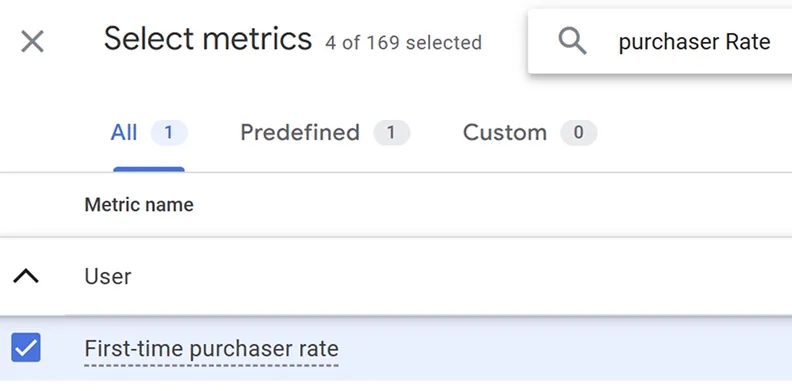
According to the documentation, the purchaser rate shows "The percentage of active users who made 1 or more purchase transactions."
Yes, usually when a marketer thinks about conversions, they’re most likely picturing the Traffic Acquisition report and the Session key event rate column. But we didn’t specify which exact conversion we wanted to see in response to the question, so I believe this task can also be counted as completed.
It’s not possible to directly compare this data with GA4’s, because while the API provides two metrics — firstTimePurchaserRate and purchaserRate — the GA4 interface only has the first. The chat used the second, so there won’t be a screenshot. But I can say after checking that the API data was taken correctly.
What percentage of users return to the website?
Chat’s answer:
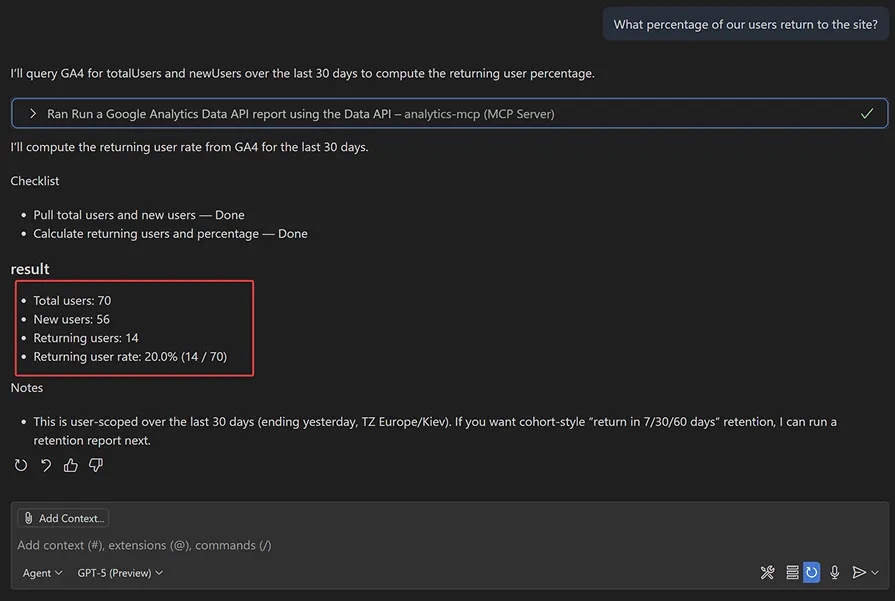
The logic in its calculations is sound, but let’s look at GA4’s data:
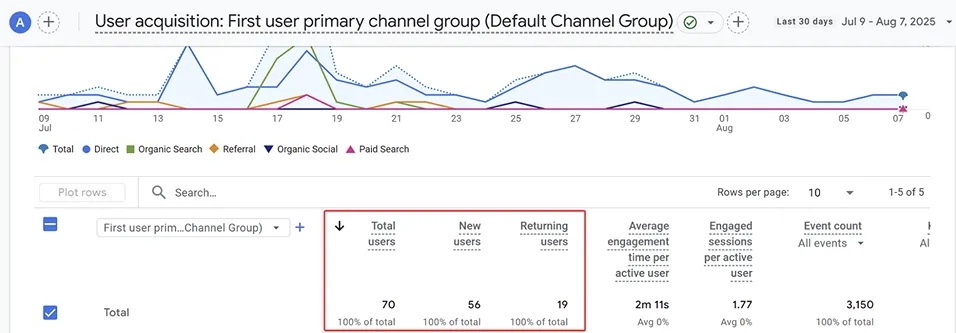
Pay attention to the Returning users column: the chat calculated 14 returning users, but in fact there were 19. As it turned out, the chat doesn’t know that in GA4, within one period, a user can be counted both as new and as returning, so it chose the wrong metrics to answer the question.
First complete miss from GPT-5.
Visitors from which browsers deliver the highest value?
Chat’s version:
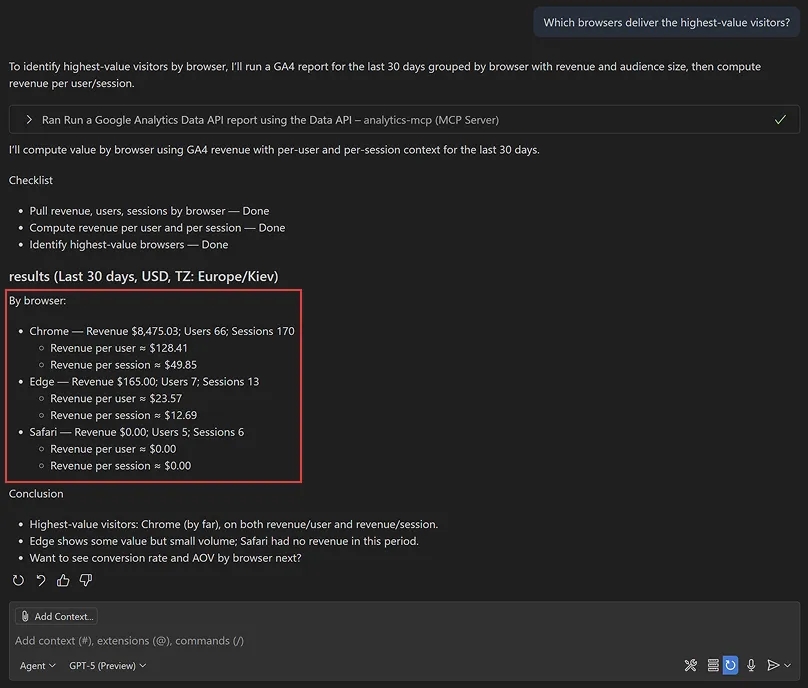
GA4’s version:
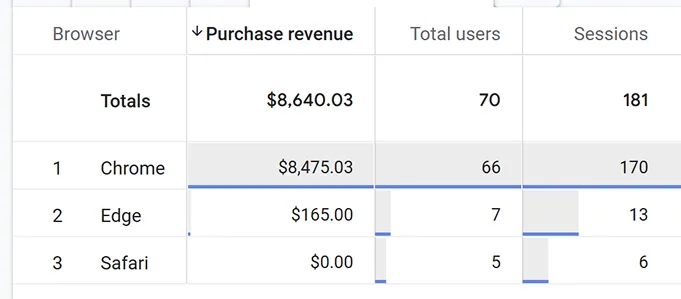
In GA4 there’s no ready-made metric that can be analyzed to answer this question, so the chat selected the necessary data itself and did it correctly. As we can see, everything matched exactly with the interface data. At the same time, the chat also calculated revenue per user and per session, whereas in GA4 you’d have to either use a calculator or Google Sheets. It also suggested further steps for analysis.
A good answer — counted as correct.
For the last two questions, I used a real GA4 property, not a test one, and with a larger dataset.
Which channels bring the most expensive customers?
Chat’s answer:
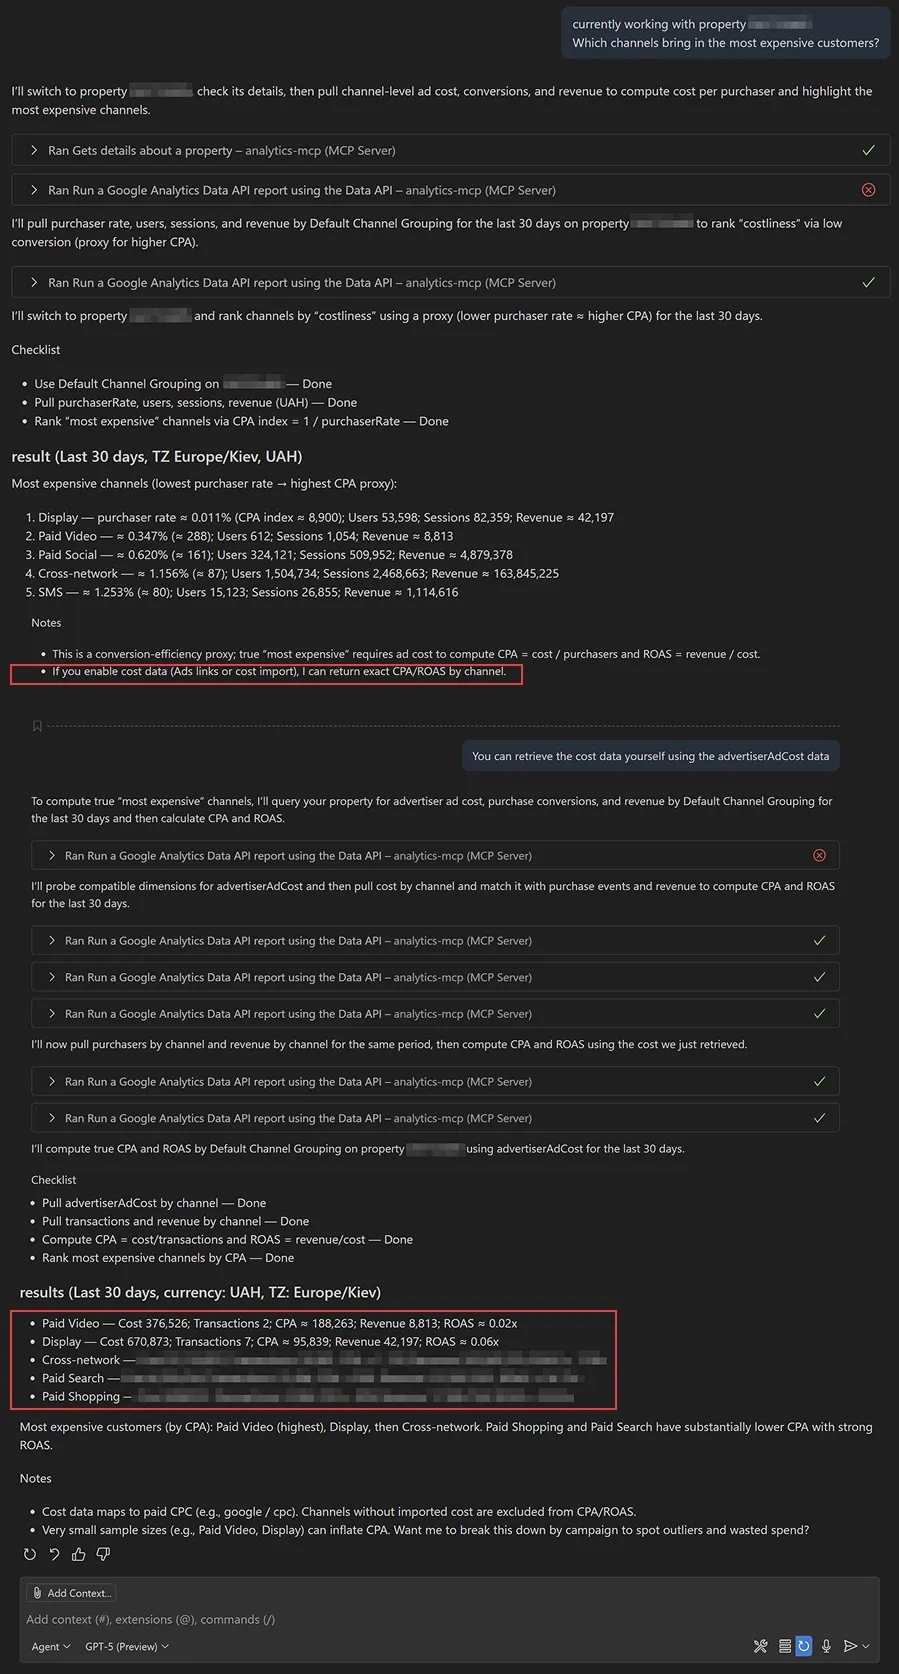
This time something went wrong, and it didn’t even attempt to get the cost data. However, it wrote about it, so I gave a hint, and in my opinion, we got a pretty decent answer. No screenshot here since this is a live project. But you can take my word for it — all the data is correct and truly worth noting.
Which channels have experienced a week-over-week decline in ROAS?
And finally — the most practical question. Chat’s answer:
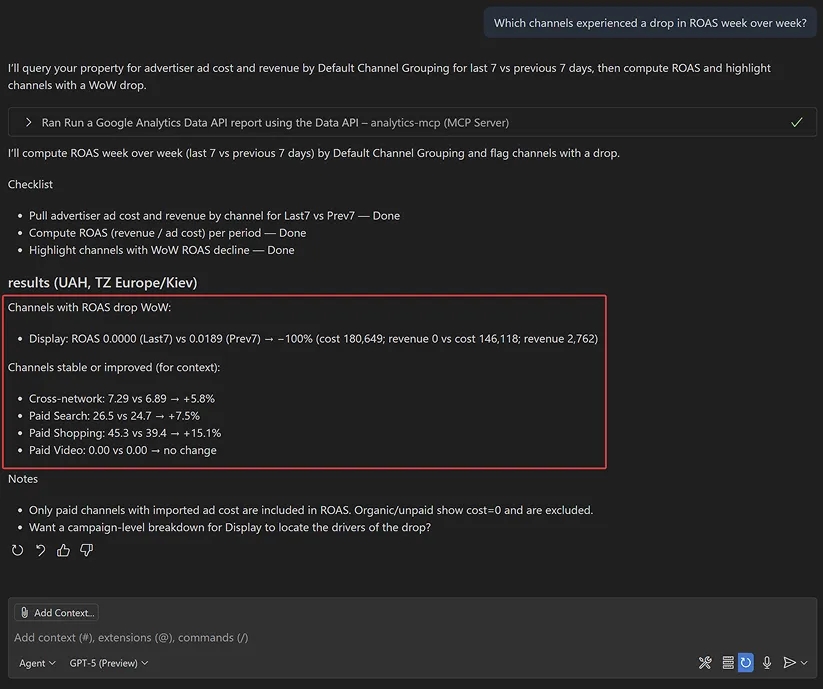
Again, no screenshot here, but trust me — it calculated everything correctly. Another good result.
Instead of a conclusion
The final result of our 10-task test is as follows:
- 7 tasks completed perfectly;
- 1 completed correctly, but a real marketer would have done it a bit differently;
- 1 completed partially, but only because the API doesn’t have a metric that exists in the GA4 interface;
- 1 completed with an error.
Of course, these aren’t particularly difficult tasks — there are many more complex ones where the results might have been worse. But these are exactly the types of questions marketers often look for answers to. And now, instead of browsing forums, you can ask them in the “chat” and immediately get not just a hint, but a ready-made answer.
Yes, it’s still not a perfect technology, and it can make mistakes. But don’t forget, people make mistakes too, and as we’ve seen, the error rate here isn’t that high. And if you add to this the checklist ChatGPT generated in response to each question, then in the right hands, this really changes the rules of the game.
The GA4 example clearly demonstrates the capabilities of this new approach. Of course, it works best when using MCP servers not only with GA4, but also with other systems a marketer works with.
There’s another side to the coin: like any new technology, this solution also has its downsides. Someone, after learning about it, might think that basic knowledge of GA4 is no longer necessary. But that’s not the case. Only an understanding of the core principles of an analytics system can help you interpret the data correctly and draw accurate conclusions. That’s why having a solid foundation is now even more important.
If this topic interests you, write which other systems you’d like me to review in future articles. And also share your impressions in the comments: do you plan to use MCP technology in your daily work?
Loading comments…