How to calculate the GA4 session suration and display in Power BI in HH:MM:SS format

The article title is admittedly long and might seem overly specific at first glance. However, it’s actually an example of how any duration-based calculation can be displayed in Power BI in a reader-friendly format. For instance:
- Video viewing time on a website
- Time to conversion
- Time between receiving a lead and closing the deal, etc.
All metrics related to time fall under this example. Session duration is a particularly popular one, as it’s an important metric for understanding visitor retention and content relevance.
If you're interested in session duration calculations, keep reading. If you're looking to display your custom time metric in Power BI in HH:MM:SS format, skip ahead.
There are two ways to calculate session duration:
- Event Timestamp Difference: This method calculates the time difference between the first and last events of a session, a classic approach from Universal Analytics. However, GA4 has an improvement: an event is also sent when a page is closed, so time spent on the last page is counted, unlike in Universal Analytics. That said, this method includes time spent on inactive tabs, which may be undesirable in some cases.
- Based on the sum of values of the
engagement_time_msecparameter. Theengagement_time_msecparameter, per GA4 documentation, counts active page time, recorded as the time in microseconds between consecutive events. Here is help, and I’ll cover this method in detail below.
In this article, I’ll focus on the second method, with the following steps:
Data Overview
I have a simple table with GA4 session data:
user_pseudo_id– a cookie assigned to a user’s device by Google Analyticssession_id– combination ofuser_pseudo_idandga_session_idevent_date– session datecountryanddevice– user’s country and device categorysession_duration_sec– explained below the sreenshot
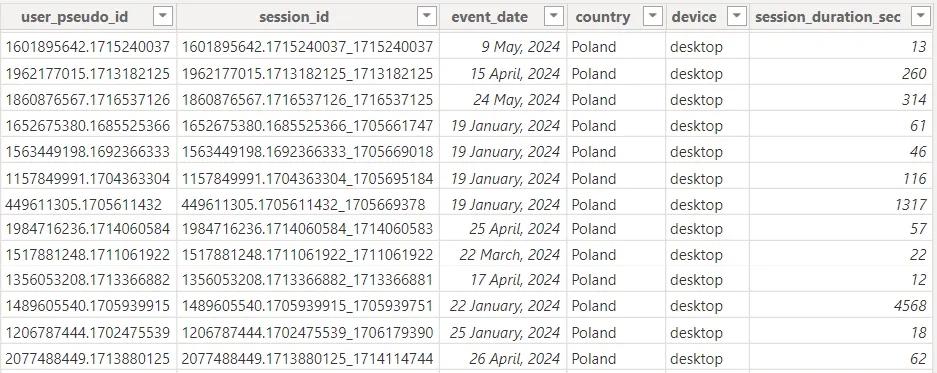
The last column here represents the sum of engagement_time_msec values, which, in GA4, measures time in milliseconds spent on the active tab since the last event. So if a user opens a page at 9:00:00 ( triggering the first page_view event) and scrolls to the end of the page by 9:00:10, at 9:00:10, a scroll event with engagement_time_msec = 10000 milliseconds (10 seconds) is sent, indicating the page was actively viewed during that time.
Since this value is in milliseconds, but we need seconds, I converted it in BigQuery by simply dividing by 1000 and rounding to a whole number:
CAST(
    SUM(
        (SELECT value.int_value FROM UNNEST(event_params) WHERE key = 'engagement_time_msec')
    ) / 1000
AS INT64) AS session_duration_sec
Add a new column in Power Query
Now let’s load the data into Power BI and head to Power Query:

Add a custom column:
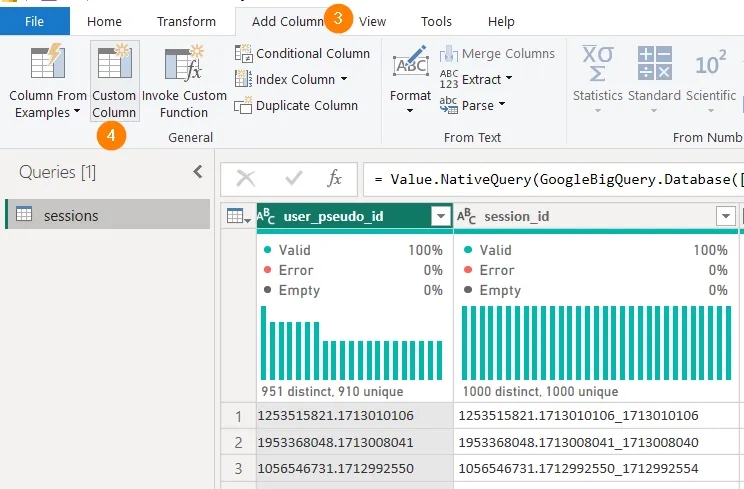
Name it something like session_duration, and enter this formula:
#duration(0,0,0,[session_duration_sec])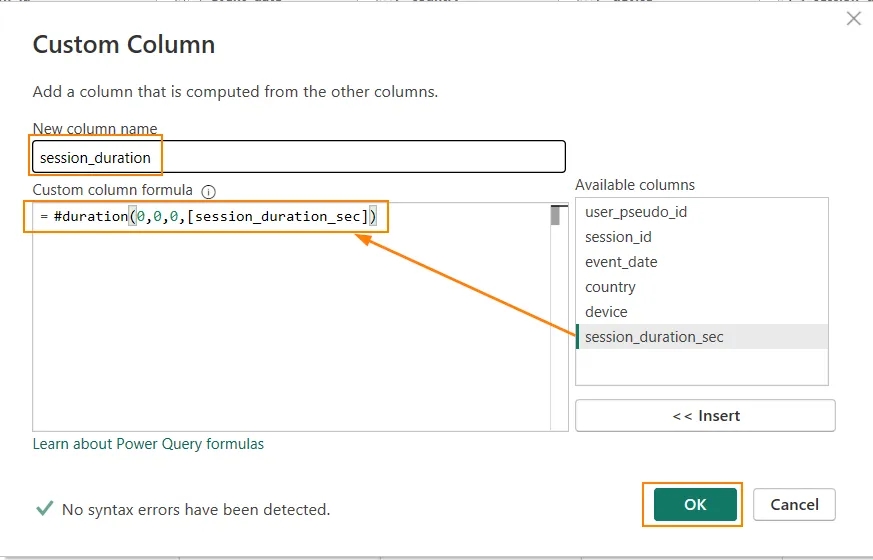
This function converts the input value to a fractional number representing a part of a day.
The explanation above is practically heaven-sent, I agree. Let’s go over it one more time. The syntax is:
#duration(days,hours,munites,seconds)In this function, you input the name of the column where your time data is recorded. For me, it’s in seconds, so my first three arguments are zeros, and the last one is the name of the column with the duration in seconds.
If your time components—like hours, minutes, and seconds—are in separate columns, you can specify them all in the respective arguments of the function. The function then converts the duration into a decimal value by dividing, for example, the number of seconds by 86,400 (the number of seconds in a day). If you only have hours, the number of hours is divided by 24, and so on. In Power BI, one hour would be represented by the number 0.04166666667 (3600 seconds / 86400 or 1 hour / 24), and one day plus one hour (25 hours / 24) by 1.04166666667.
And of course, here’s a link to the documentation. I hope this clears things up, but if you still have questions, feel free to ask them in the comments below.
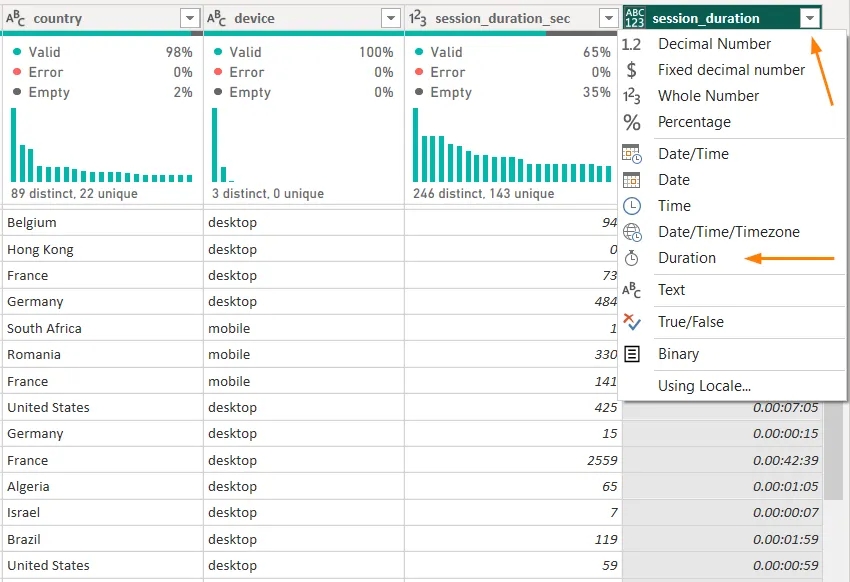
Once the new column is added, simply set its type to Duration and click Close and Apply to load the changes into Power BI.
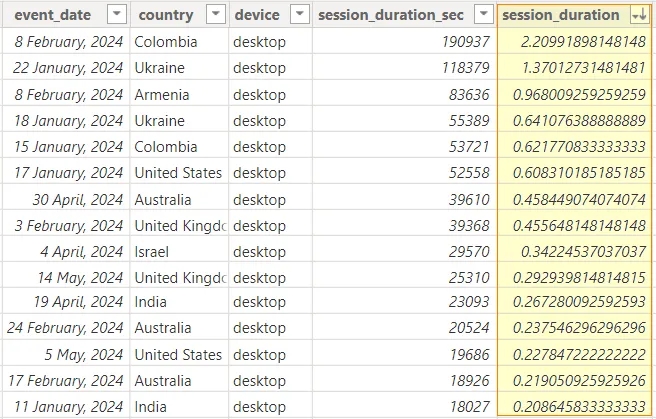
In Power BI, this column looks like this:
Calculating average session duration
This measure will have four variables, and I’ll build it step-by-step to clarify what’s happening. I also recommend checking each step in Power BI to avoid errors, especially if you’re new to writing measures.
- Calculate the average session duration in our new column and store it in a variable
_avg
AVG Session Duration =
VAR _avg = AVERAGE(sessions[session_duration])

RETURN _avg
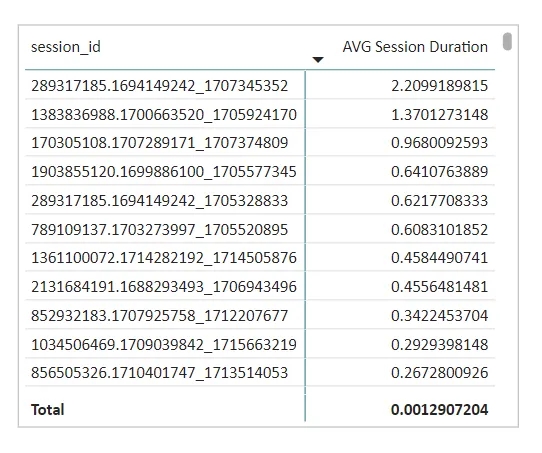
This will display the same figures as the original table when broken down by session, but it now works with other breakdowns, like by device category.
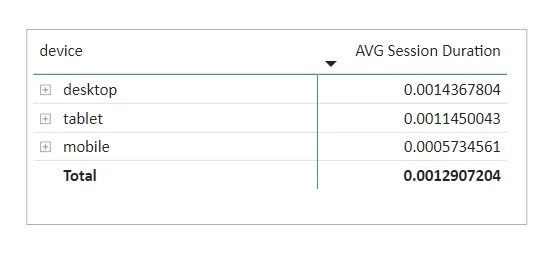
But now it also works when broken down by parameters. For example, we have duration data at the device level.
2. Formatting values for readability
For formatting, the FORMAT function is ideal. According to the documentation use H or HH for hours, depending on whether you want a leading zero, N or NN for minutes, and S or SS for seconds.
Let’s update our measure with a new _h variable and display its value accordingly.
AVG Session Duration =
VAR _avg = AVERAGE(sessions[session_duration])
VAR _h = FORMAT(_avg, "HH:NN:SS")


RETURN _h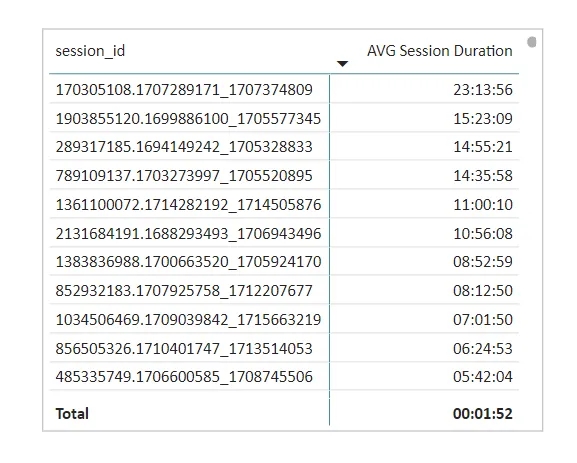
It looks like what we need, but only at first glance. Here’s where you should understand why I'm displaying the measure broken down by sessions, which we won’t actually use in the report.
Those paying close attention may have noticed that in the previous screenshot, there were two sessions lasting over 1 (i.e., more than a day). But in the second screenshot, the longest session we have is 23:13:56. I’ll filter out those two and display three measures for comparison — the value of the _avg variable, _h separately, and the correct one we're aiming for.
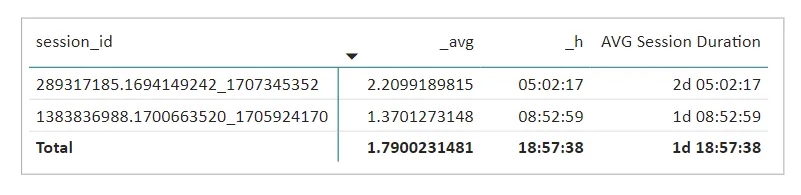
As you can see, our variable _h only returns the time remaining after the full days, while ignoring the days themselves. I hope this helps you feel just how easy it is to overlook something critical during calculations. From my perspective, around 60-70% of data work time — definitely at least half — goes into, and should go into, validation and debugging.
Overconfidence is a serious enemy for an analyst. It leads to errors, which then result in inaccurate data and poor decisions based on that data. So, learn to embrace a little paranoia and always verify your work. Don’t rush to explain what you see. I recommend approaching everything with a degree of skepticism and always thinking critically.
One more note: of course, I could have provided the final formula and said, “here, use this,” and you would have copy-pasted it without really understanding what it does. But that’s not why I write my guides — not for that...
3. Adding Days
Let's move on. In fact, the _h variable gives us exactly what we ask for—hours, minutes, and seconds. But we’re not asking for days, though we should. Since days are the integer part of the decimal, we can retrieve them easily with the INT function, which returns the integer. We’ll add a new _days variable before _h, where it logically belongs.
AVG Session Duration =
VAR _avg = AVERAGE(sessions[session_duration])
VAR _days = INT(_avg)
VAR _h = FORMAT(_avg, "HH:NN:SS")


RETURN _days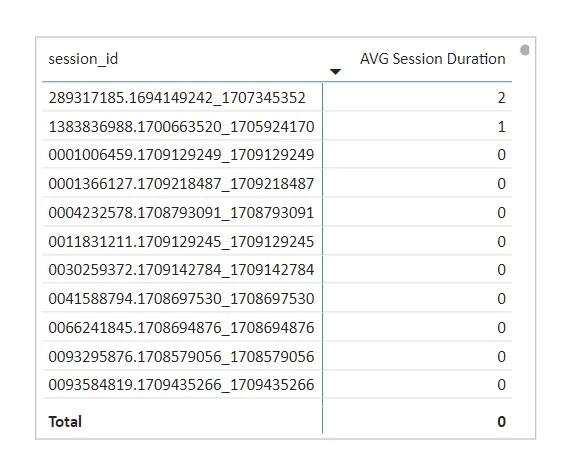
This variable gives us the days. All that’s left is to combine days and time, displaying the days only if they are present (i.e., if the integer is greater than zero).
AVG Session Duration =
VAR _avg = AVERAGE(sessions[session_duration])
VAR _days = INT(_avg)
VAR _h = FORMAT(_avg, "HH:NN:SS")

RETURN
    IF(
        _days > 0,
        _days & "d " & _h,
        _h
    )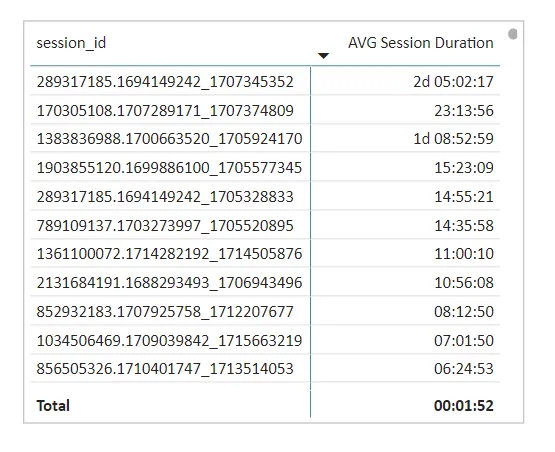
At the report level and for sessions, it may not always make sense to display hours unless you're Netflix, so we can add another condition—_avg > 0.04155—which will show hours if they’re present (the average value should be greater than 0.04155, just under an hour), and in other cases, it will display minutes from the _m variable.
One more detail here. The FORMAT function always returns values, even empty ones, in text format. So if we just return _m, we might see blank rows in the report where a reference value exists but no sessions occurred. To prevent this, we add a check — to display _m only if there’s some duration present (i.e., the _avg value is not blank). For this, we’ll use the SWITCH function, which by default returns BLANK, which is what we want, as Power BI hides such rows in visuals.
AVG Session Duration =
VAR _avg = AVERAGE(sessions[session_duration])
VAR _days = INT(_avg)
VAR _h = FORMAT(_avg, "HH:NN:SS")
VAR _m = FORMAT(_avg, "NN:SS")

RETURN
    SWITCH(
        TRUE(),
        _days > 0, _days & "d " & _h,
        _avg > 0.04155, _h,
        NOT ISBLANK(_avg), _m
    )
Final result
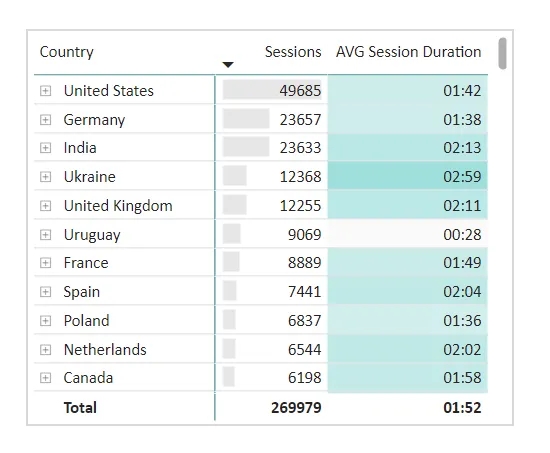
Now we can confidently use our final measure in the report, for example, alongside the number of sessions and a breakdown by countries.
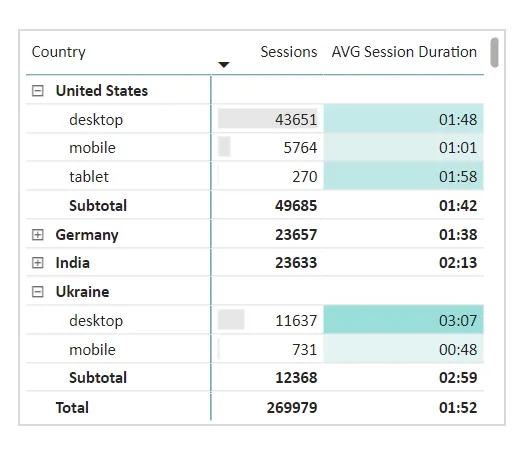
Or, of course, by devices as well.
Instead of conclusion
...and for those who continue reading 🙂
I don’t know if you considered this alternative method while reading the article, but if not, I’ll share it with you.
In fact, we can divide by 86400 without using Power Query. We can do it at the data processing stage in BigQuery by simply adding “ / 60 / 60 / 24.”
CAST(
    SUM(
        (SELECT value.int_value FROM UNNEST(event_params) WHERE key = 'engagement_time_msec')
    ) / 1000
AS INT64) / 60 / 60 / 24 as session_duration_bq
The data type of this column can remain as “decimal number” without changing it to “duration,” and we can just use it in the final measure—the result will be the same.
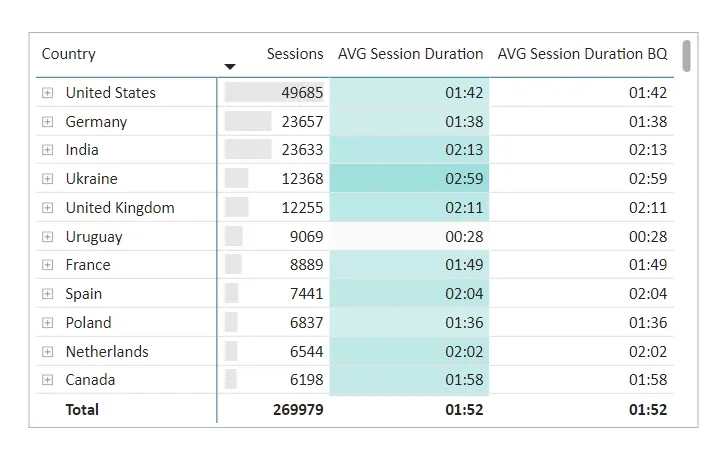
This method:
a) is faster,
b) doesn’t burden the report with an additional column of high granularity.
Oh, I can hear you now—“Why didn’t you, Natasha, tell us about this right away?!!”
It’s simple: I wanted you to know both methods. And to be able to achieve your goal without needing access to raw data edits and/or if your hours/minutes/seconds are in different columns.
Overall, I think the more ways you have to solve problems in your “active vocabulary,” the more optimized and refined your work will be.
I hope you’re not too angry with me now, but if you are — feel free to share your opinion in the comments. What else is this opportunity for, after all? 🙂
Loading comments…