How to Track 404 and JavaScript Errors on Your Website with GTM — and Why You Should Do It on Every Site

Vibe coding has changed the rules of the game. Today you can launch a website in a matter of hours — without deep technical knowledge, without a development team. AI tools generate code fast, but not always correctly. And while a business owner is celebrating a quick launch, the site may contain errors that no one knows about — errors that are quietly costing the business potential customers.
A user clicks a banner on the homepage, lands on a 404 page, and leaves the site. After clicking the "Submit" button, the form doesn't send and nothing happens on the page. A JavaScript error breaks the checkout process, but no one sees it except the user themselves.
How do you find out when something goes wrong? There are different approaches: some are more developer-oriented, others are more analytics-oriented. Among the latter, two approaches stand out:
- Watching session recordings in Microsoft Clarity, Hotjar, FullStory, or similar tools — you can clearly see what the user was doing before the error occurred, but reviewing the recordings themselves usually takes a lot of time, even with filters set up, which aren't available in all session recording services for this particular task.
- Or you can track errors through Google Tag Manager — this lets you collect custom events directly in your familiar GA4 reports and segment audiences to clearly assess how technical failures impact overall conversion and business revenue. That's exactly what we'll be talking about today.
Don't get me wrong — I don't think the first approach is bad or not worth your attention. It has its own practical use cases; it's just not our topic today.
Setting up 404 page tracking in GTM
When a user lands on a non-existent page, they most often simply close the site. There are many reasons 404 errors appear: URL structure changed after a redesign, a page was deleted, an external site links to an outdated address, AI assistants and LLMs like ChatGPT often "hallucinate" and generate fictional, non-existent links for users. On top of that, 404 pages directly affect SEO. And what's the first step if we want to fix all the broken URLs? Exactly — collect a list of them.
The simplest approach is to set a condition based on the page title. Most CMSs and website builders automatically assign a characteristic title to the 404 page: "Page Not Found," "Сторінку не знайдено," or something similar.
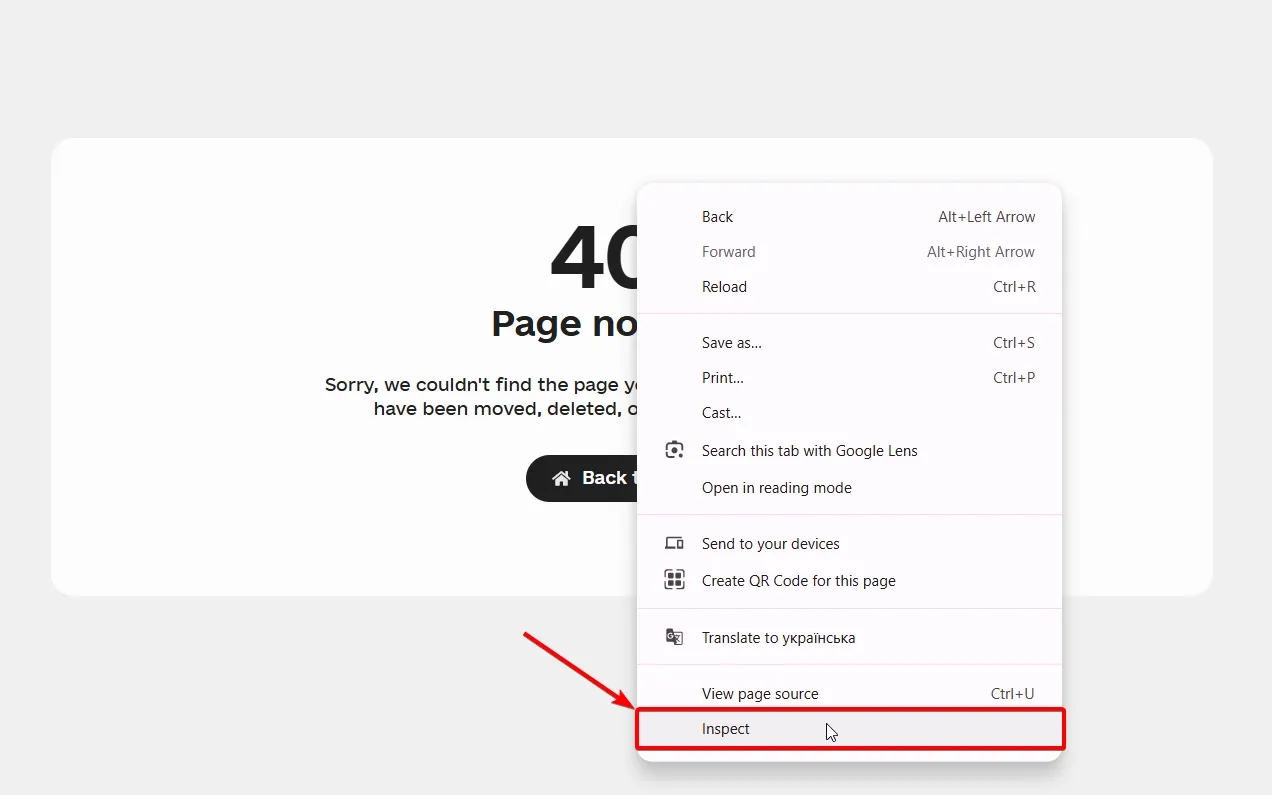
Checking this on your site is straightforward: enter your site's address in the browser with a random non-existent path, for example yourdomain.com/abcde123. Right-click on the page and select Inspect.
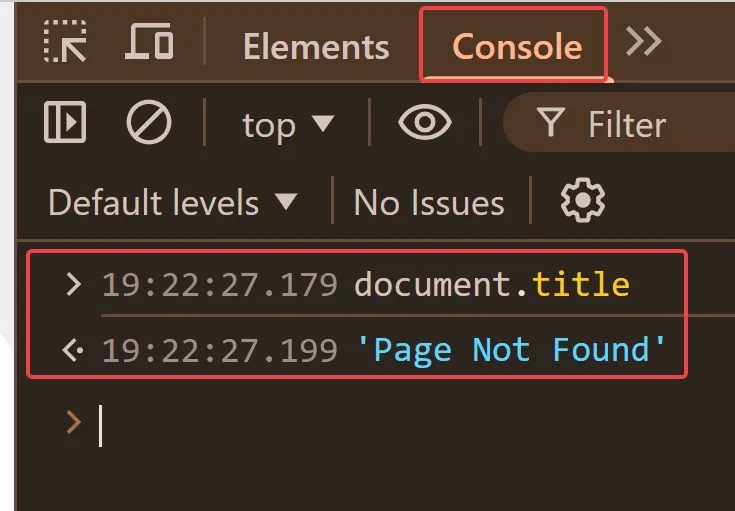
Then switch to the Console tab, type document.title and press Enter — this is the value we'll be using for the setup.
To do this:
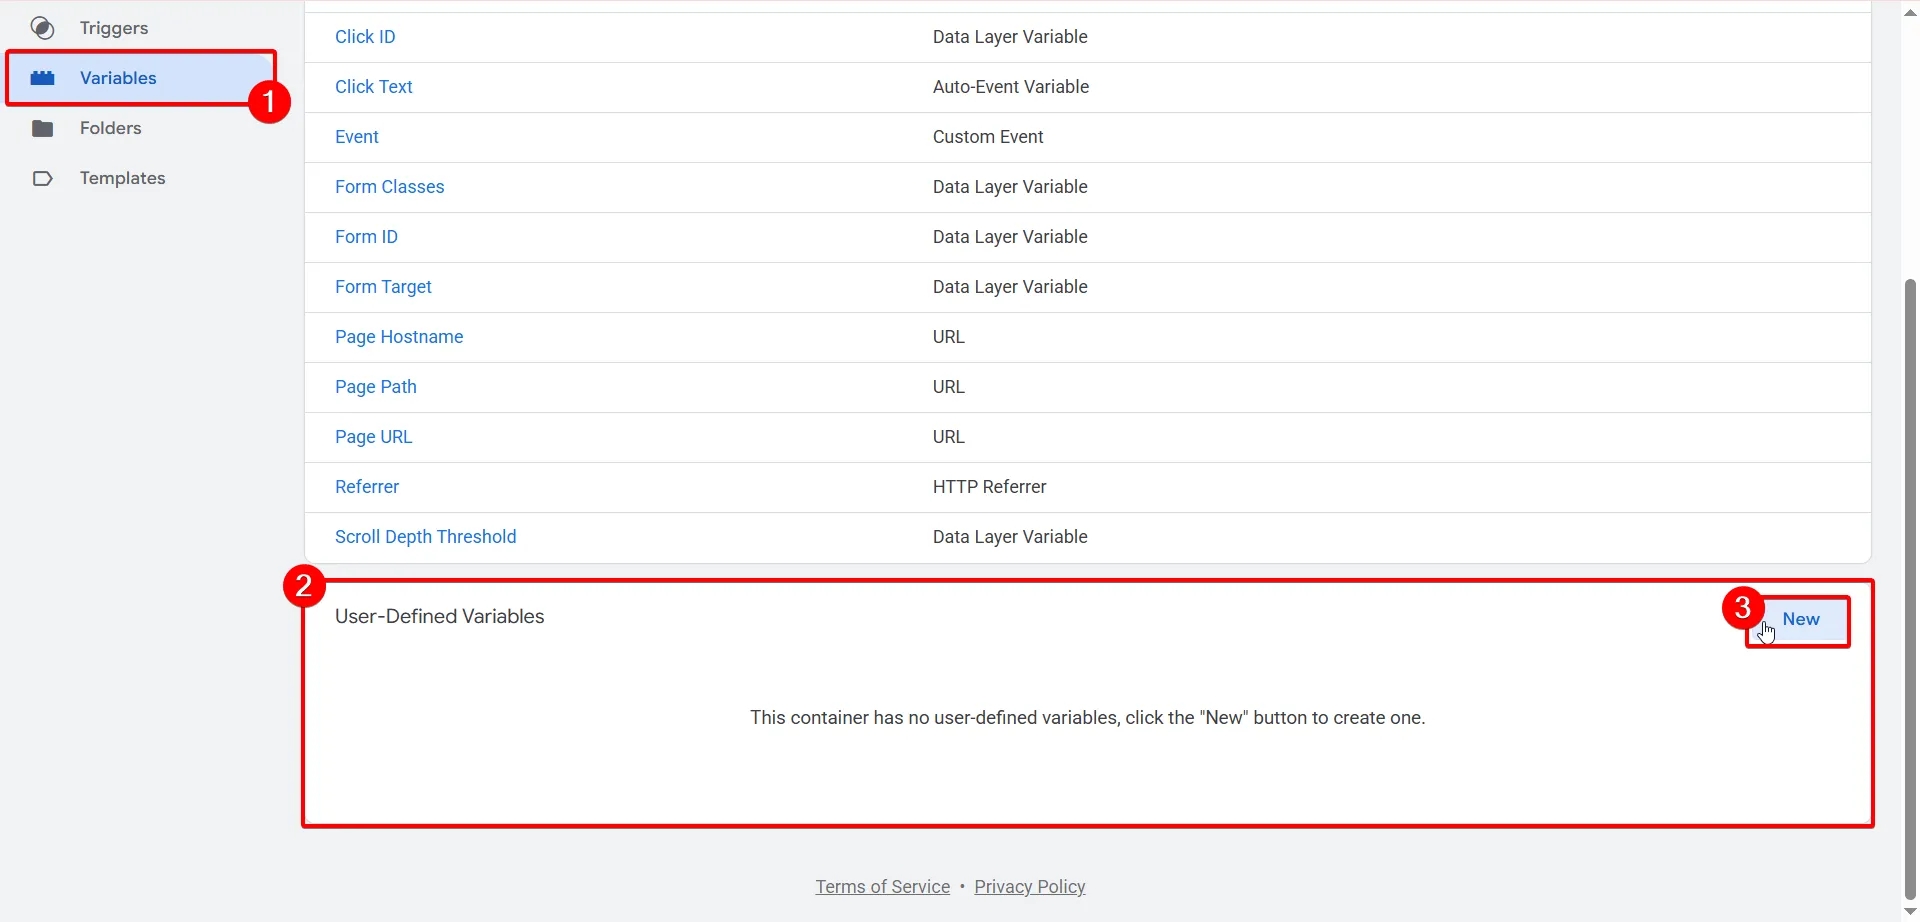
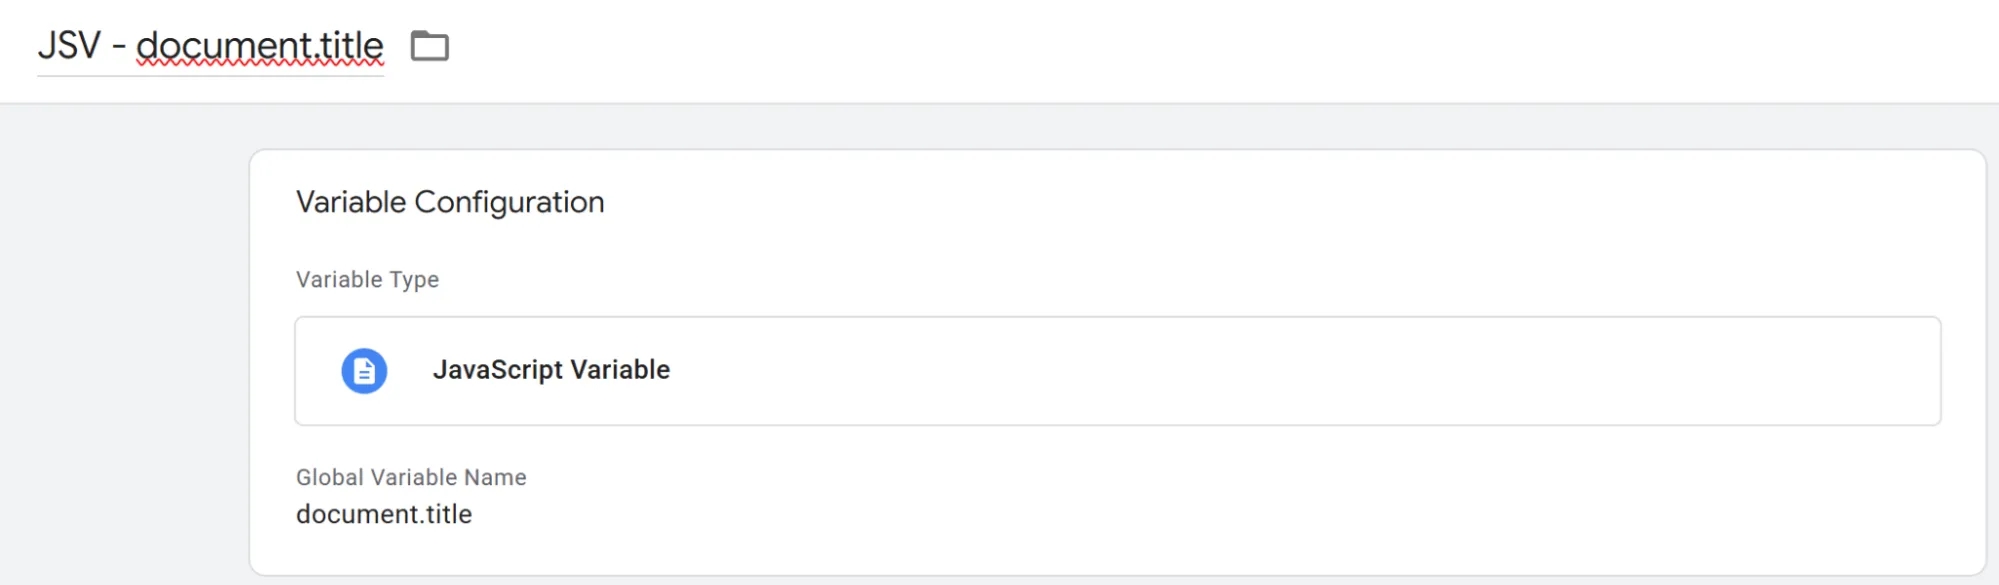
- Create a new custom variable under Variables → User-Defined Variables → New.
- Select the variable type JavaScript Variable.
- In the Global Variable Name field, enter document.title.
- Name the variable JSV - document.title and save.
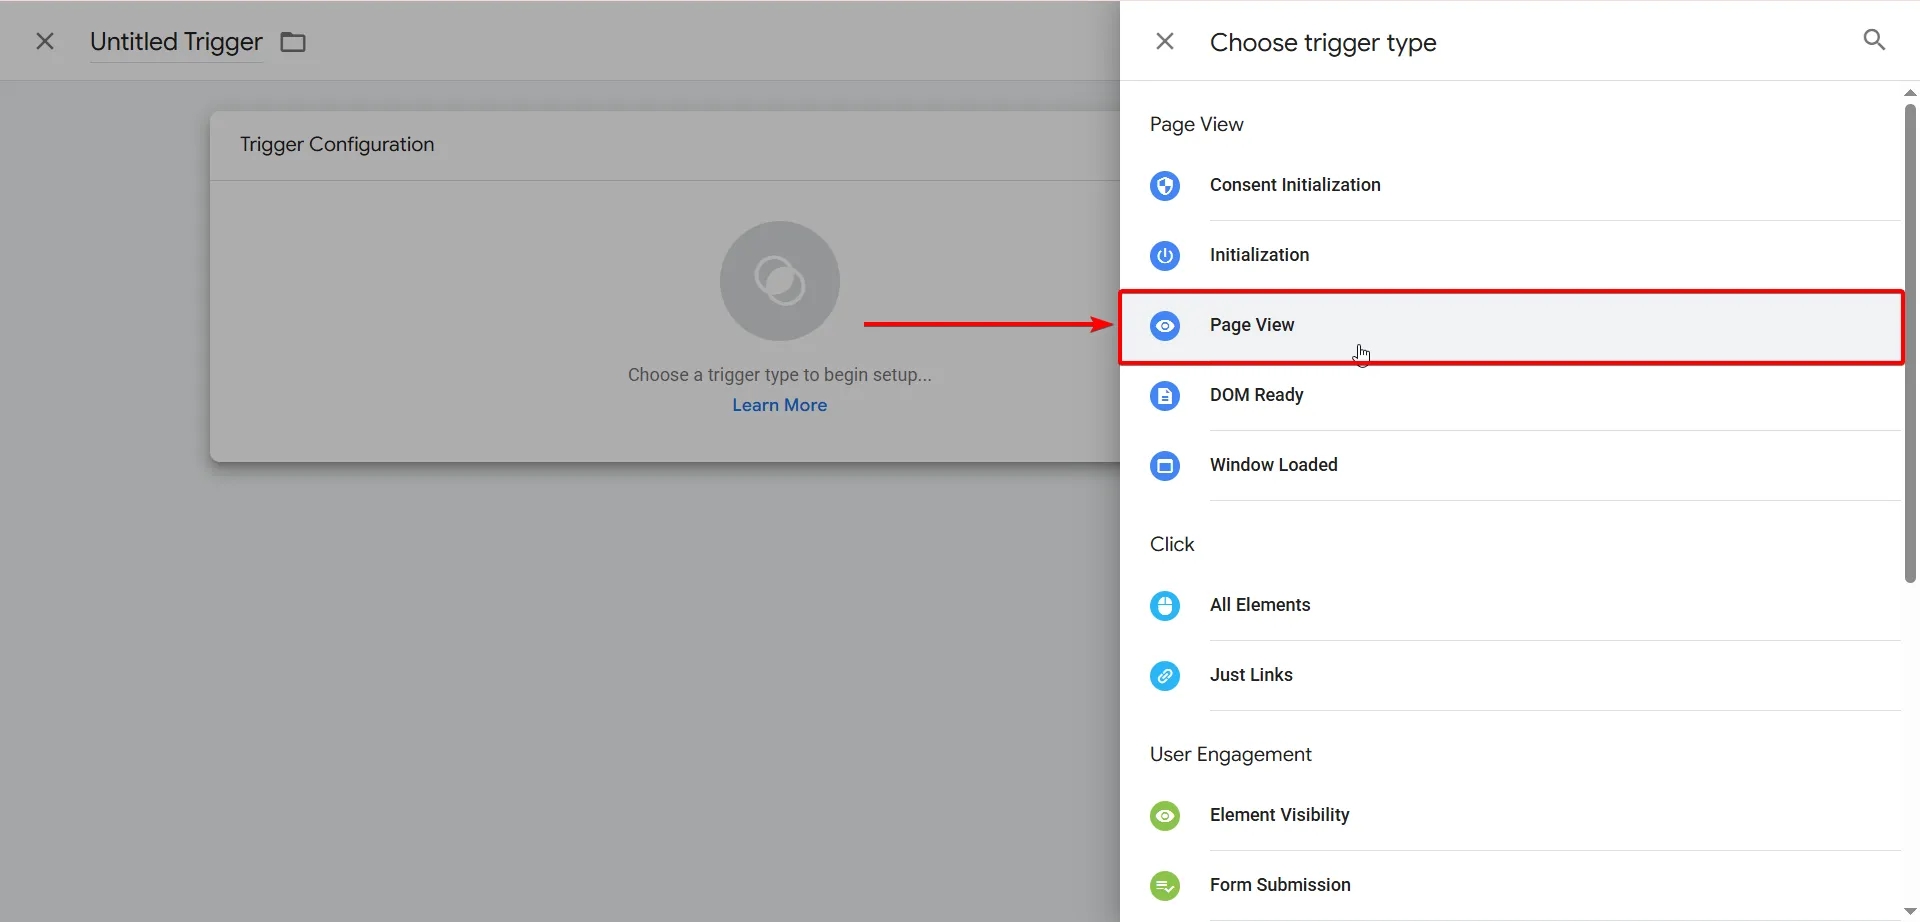
2. In GTM, go to Triggers and create a trigger of type Page View.
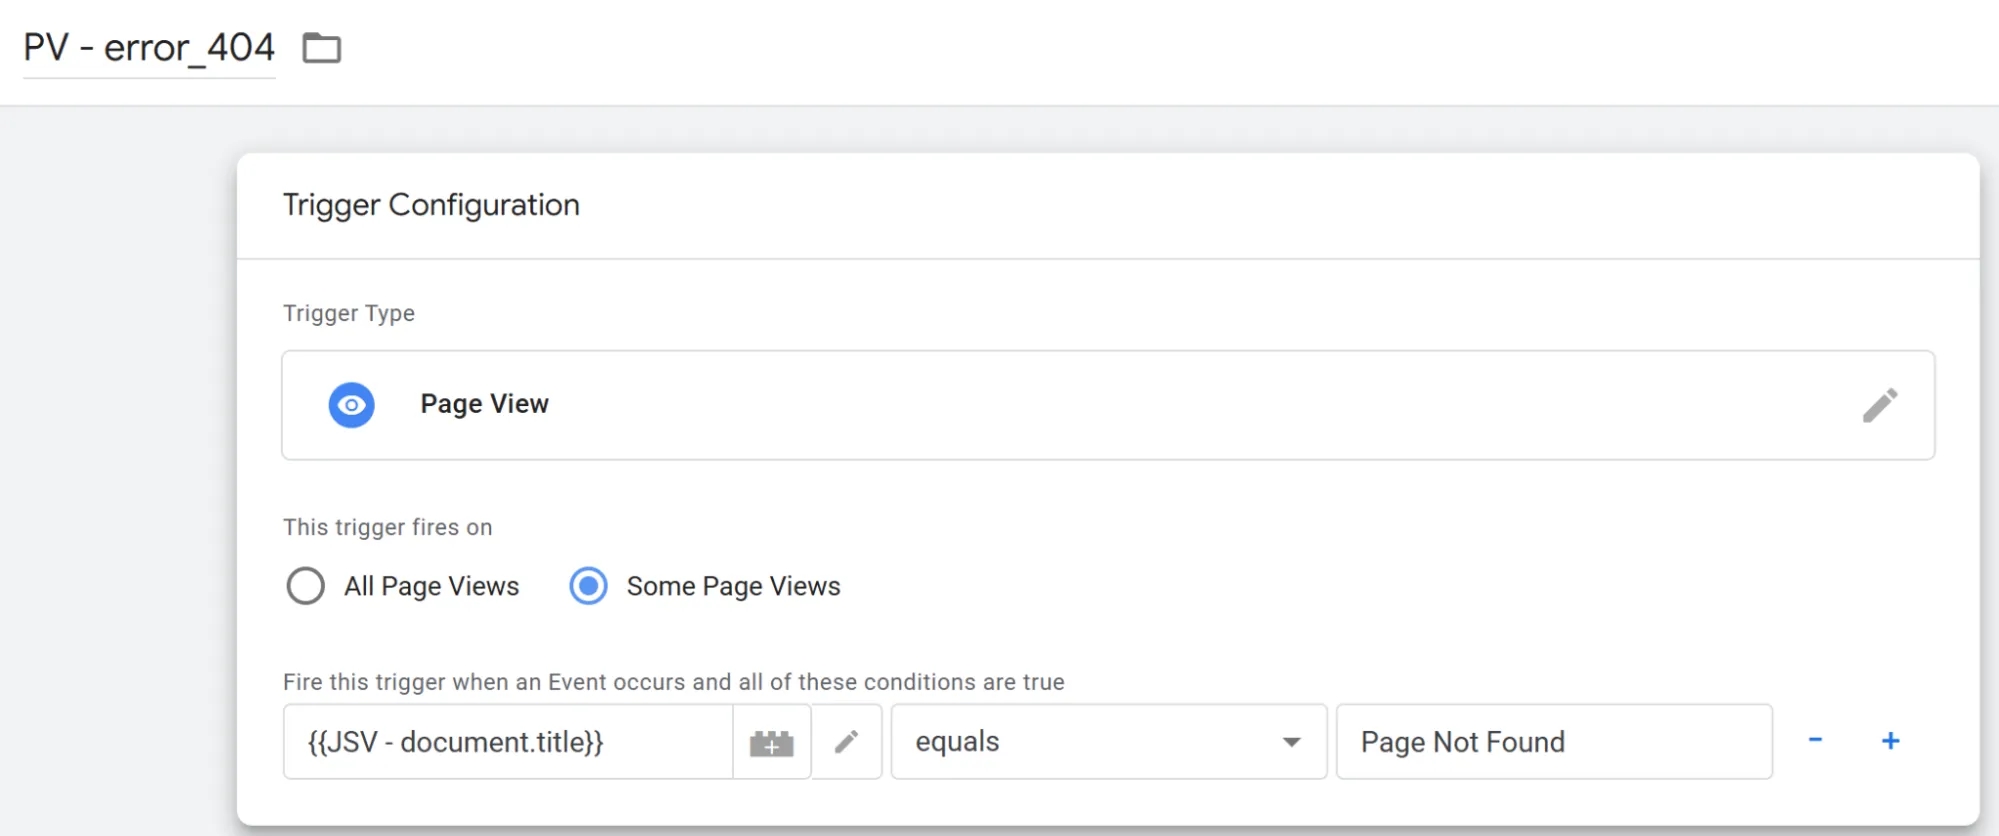
- Set the activation condition: the variable JSV - document.title equals [your page title value].
- Give the trigger a name and save it.
3. Go to Tags → New.
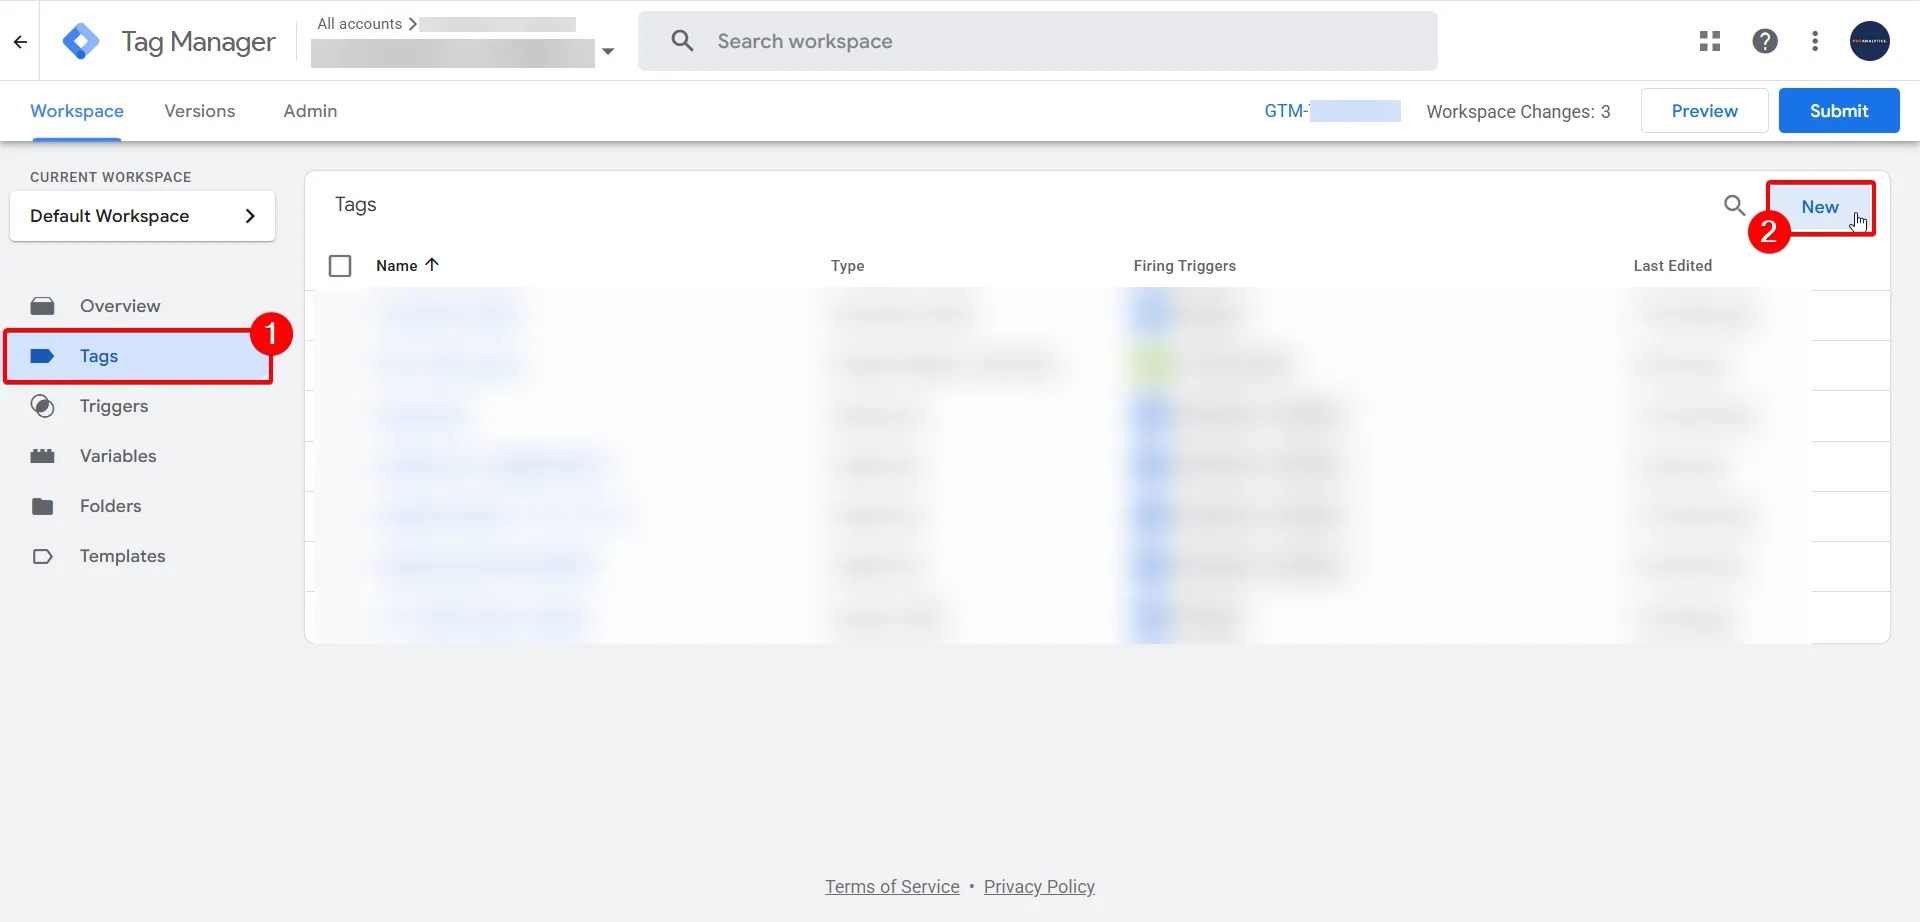
- Select the tag type Google Analytics: GA4 Event.
- In the Event Name field, enter the event name: error_404.
- Under Triggering, select our trigger
PV - error_404. - Name the tag: GA4 - error_404 and save.
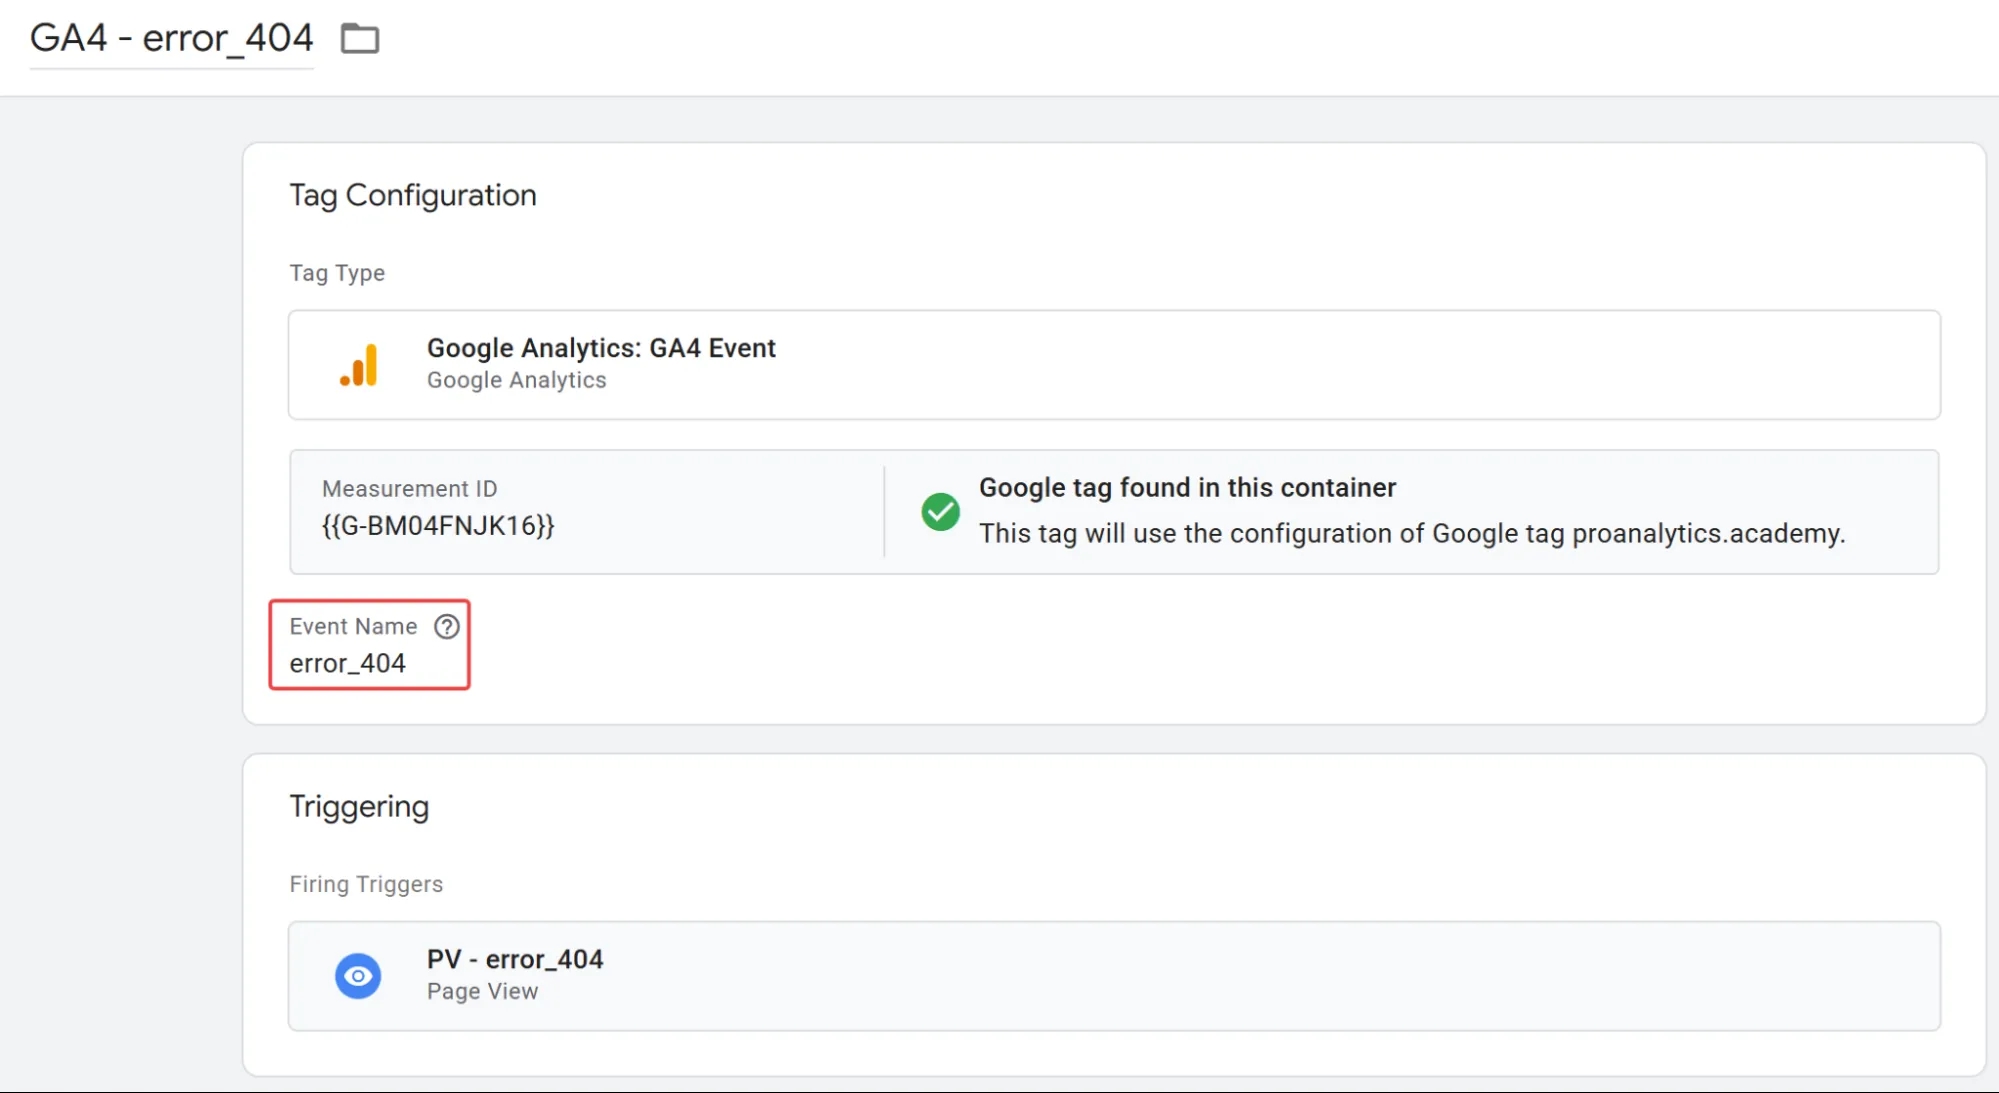
Don't forget to publish the container.
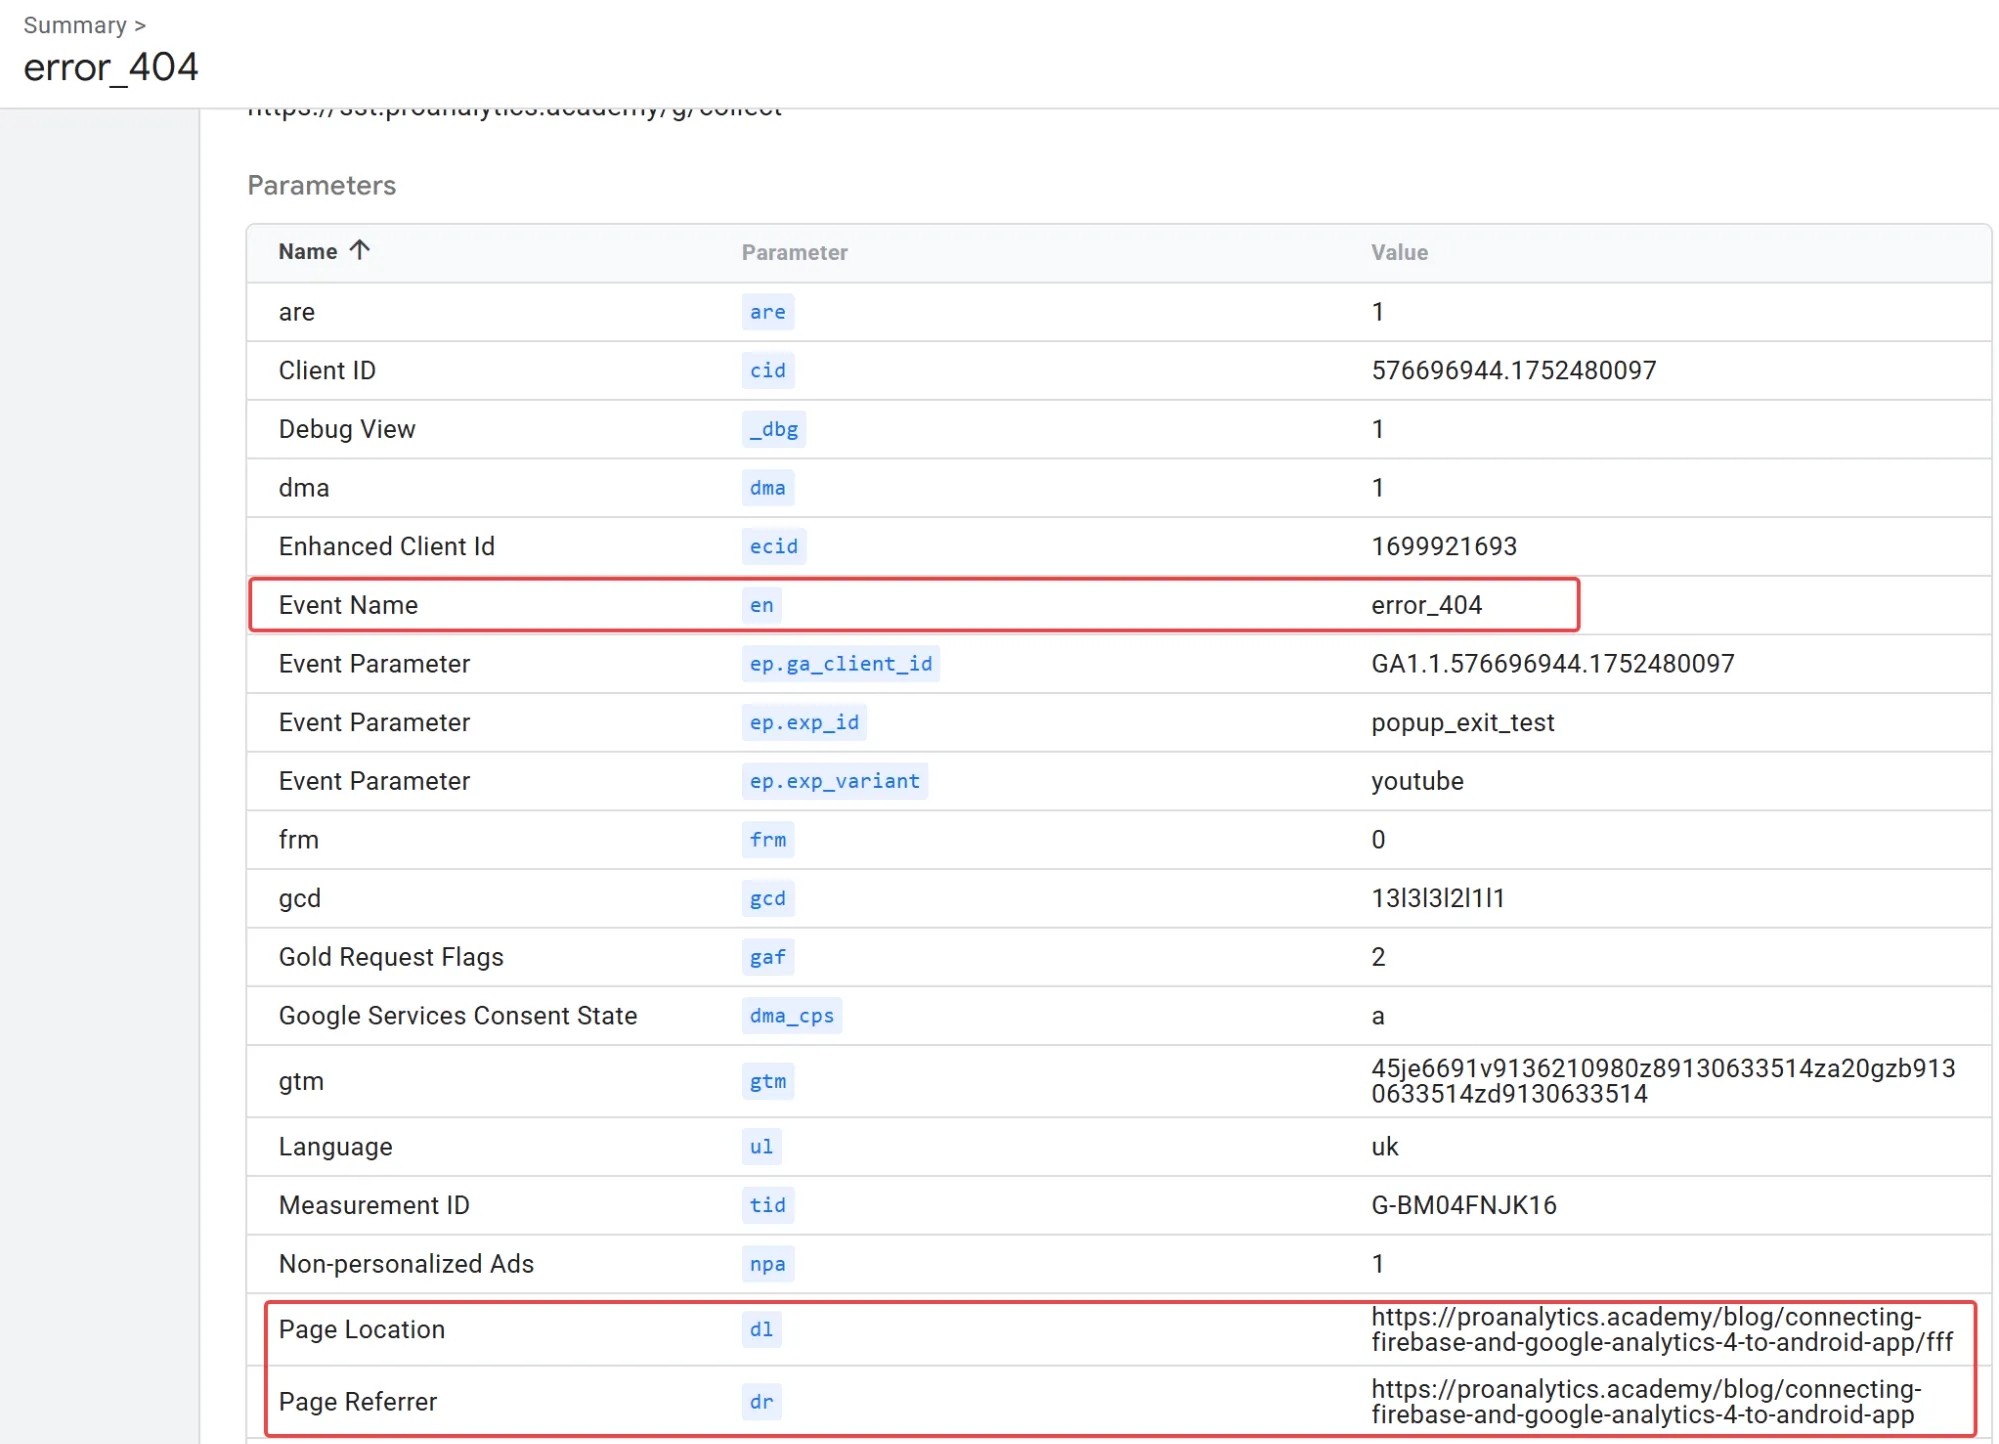
Since GA4 automatically collects information about the page where the action occurred and the value of document.referrer, this event will let you see both which page is generating the error and which page the user came from.
Setting up JavaScript error tracking in GTM
JavaScript errors are often "invisible" broken elements on a site: a button that doesn't respond to a click; a form that won't submit; a script that has frozen, and so on. Tracking them is especially relevant for AI-generated sites: vibe coding speeds up development, but generated code often contains non-obvious errors that only appear under real usage conditions. The user sees that "something isn't working" and leaves, while you don't even know where to look for the problem.
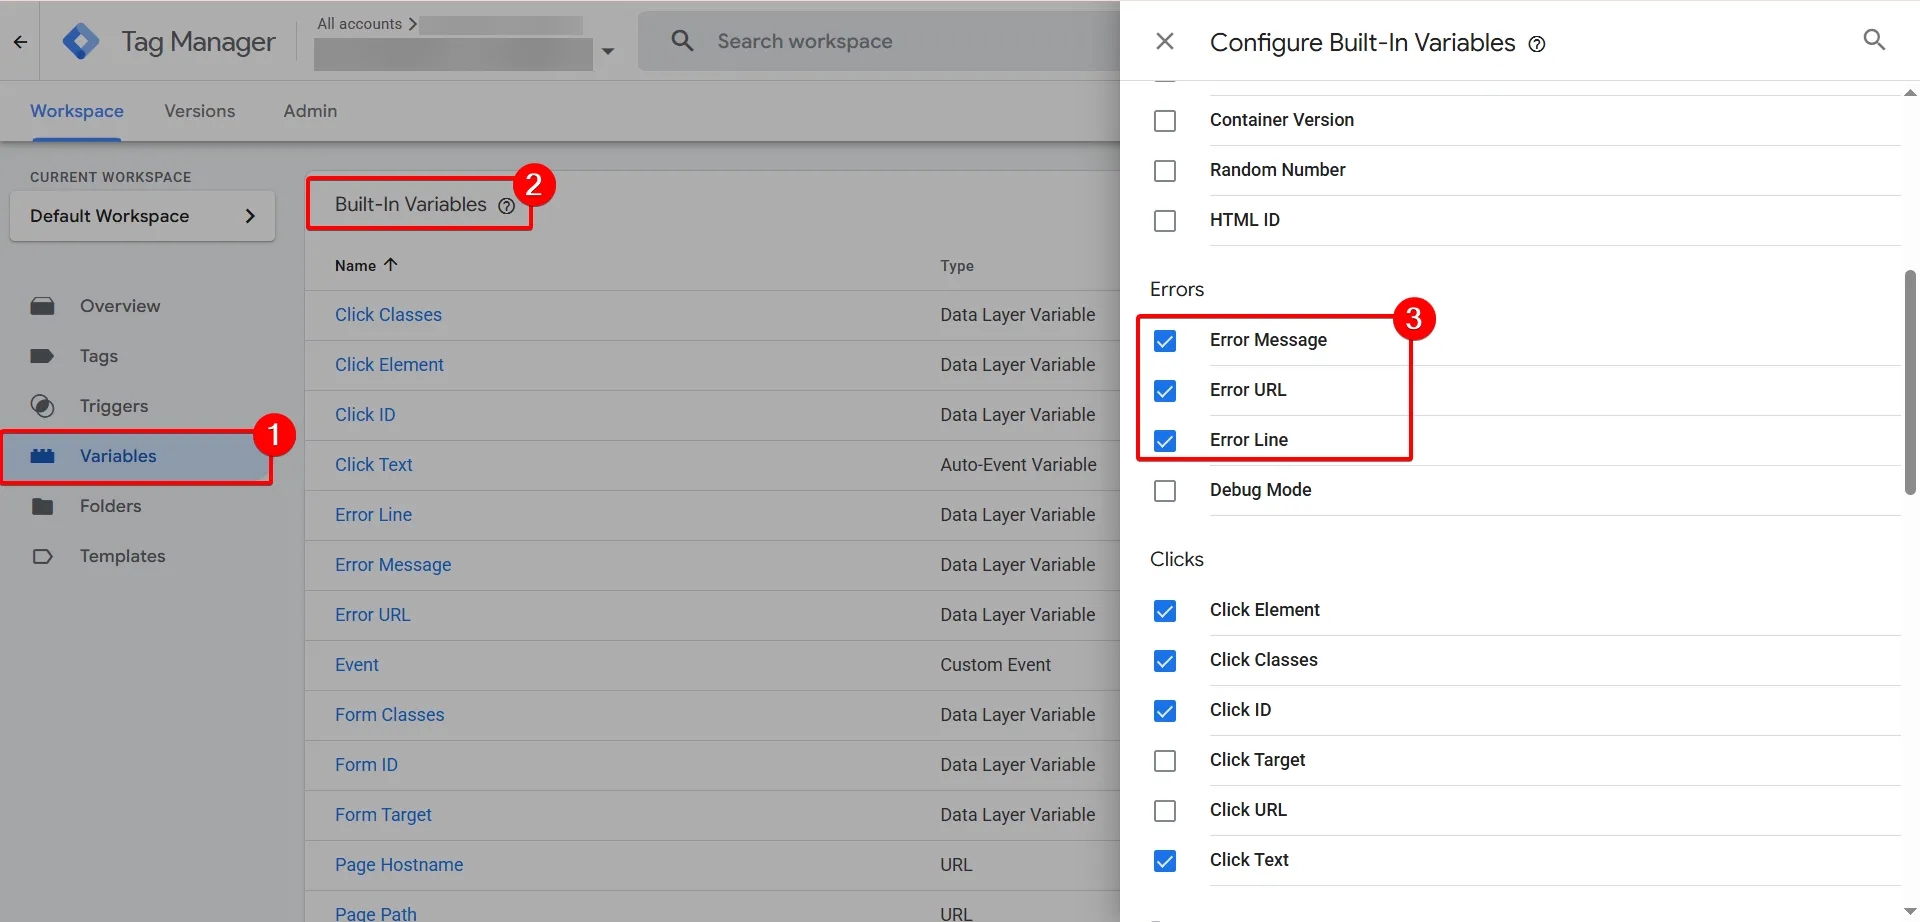
First, let's enable the built-in variables.
- Go to the Variables section.
- In the Built-In Variables block, click Configure.
- Scroll down to the very bottom, find the Errors block, and check the boxes next to three variables:
- Error Message — the error text.
- Error URL — the page where the error occurred.
- Error Line — the line of code where the error originated.
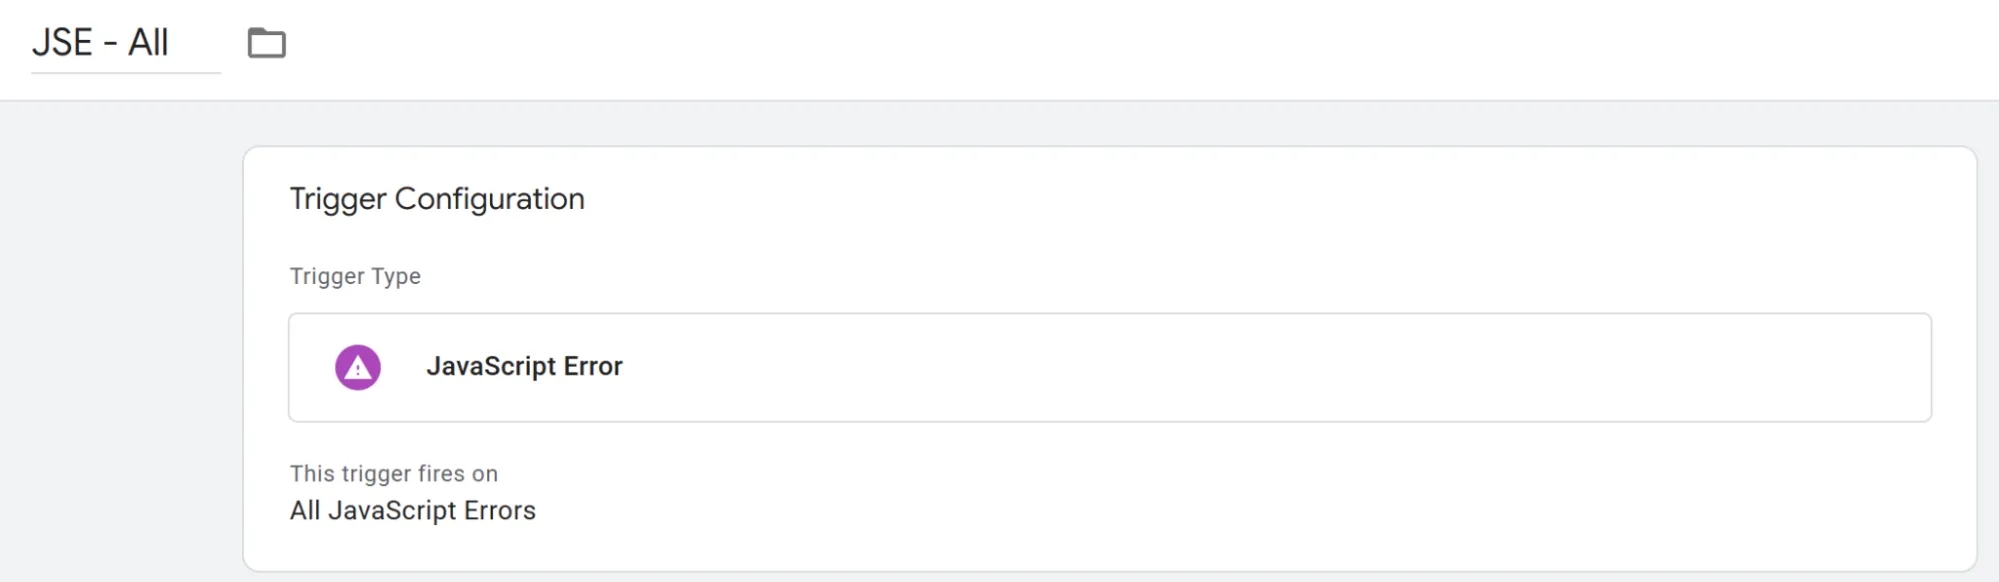
4. Go to Triggers → New.
- Select the trigger type JavaScript Error.
- Name the trigger and save it.
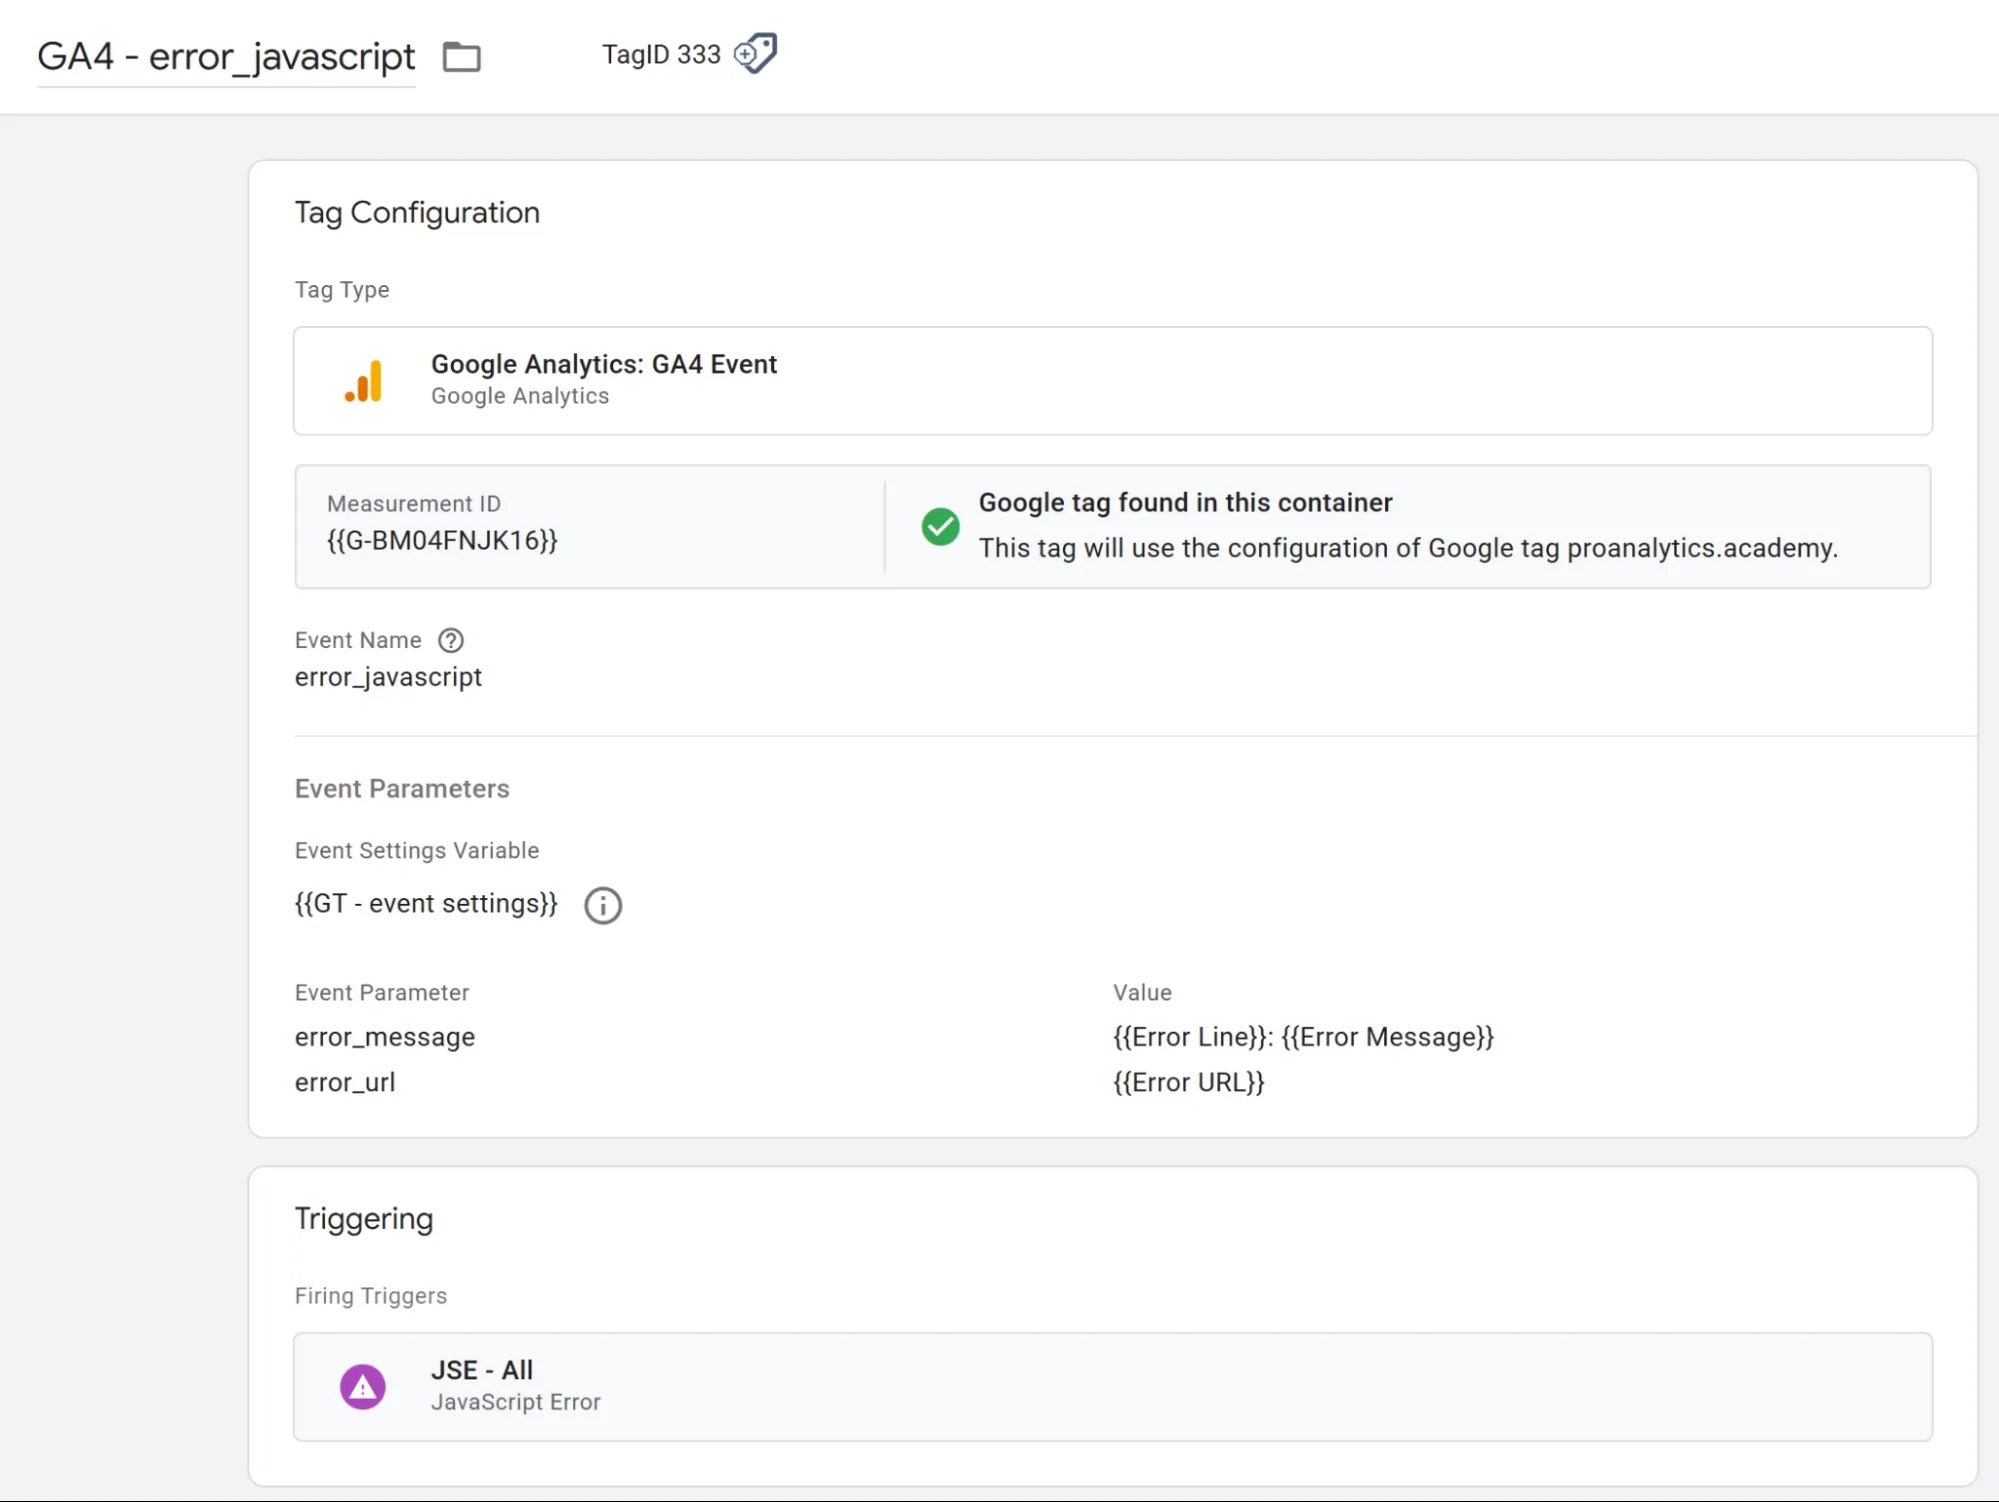
5. Go to Tags → New. Select the tag type Google Analytics: GA4 Event.
- In the Event Name field, enter:
error_javascript. - In the Event Parameters block, add two parameters:
- error_message → {{Error Line}}: {{Error Message}}
- error_url → {{Error URL}}
You can add all three parameters separately, but {{Error Line}} contains only the line number that generated the error, so it pairs nicely with {{Error Message}}. This way you immediately understand both which line the error occurred on and what the error actually is — without spending an extra custom parameter in GA4.
- Under Triggering, select the trigger from the previous step. In my case — JSE - All.
- Name the tag GA4 - error_javascript and save.
Don't forget to publish the container.
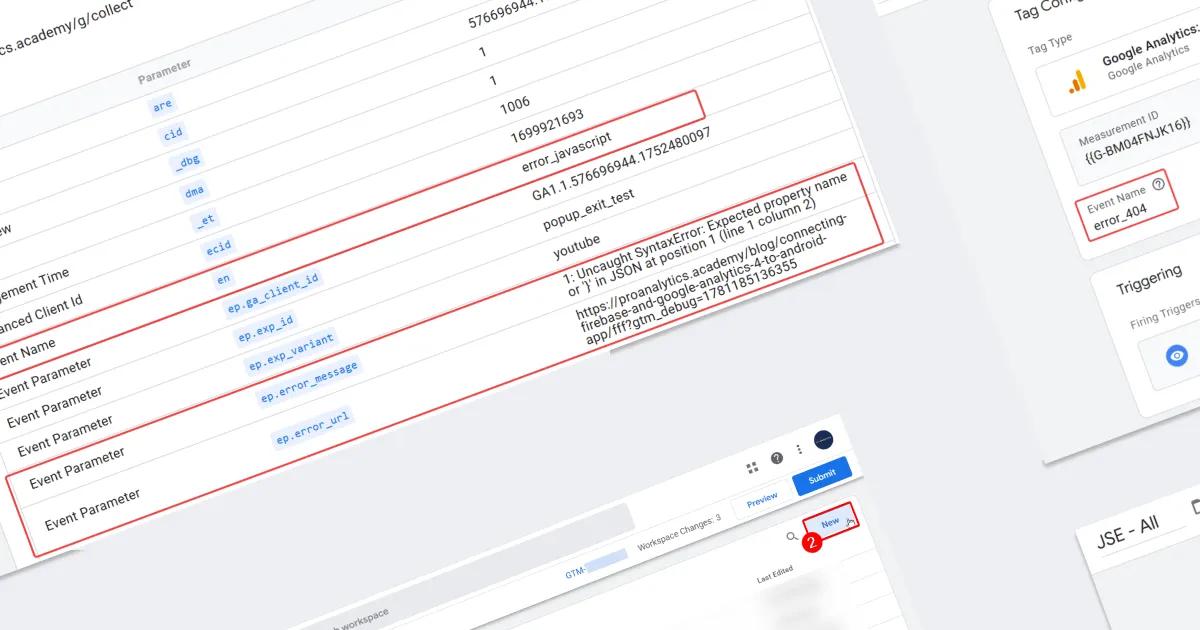
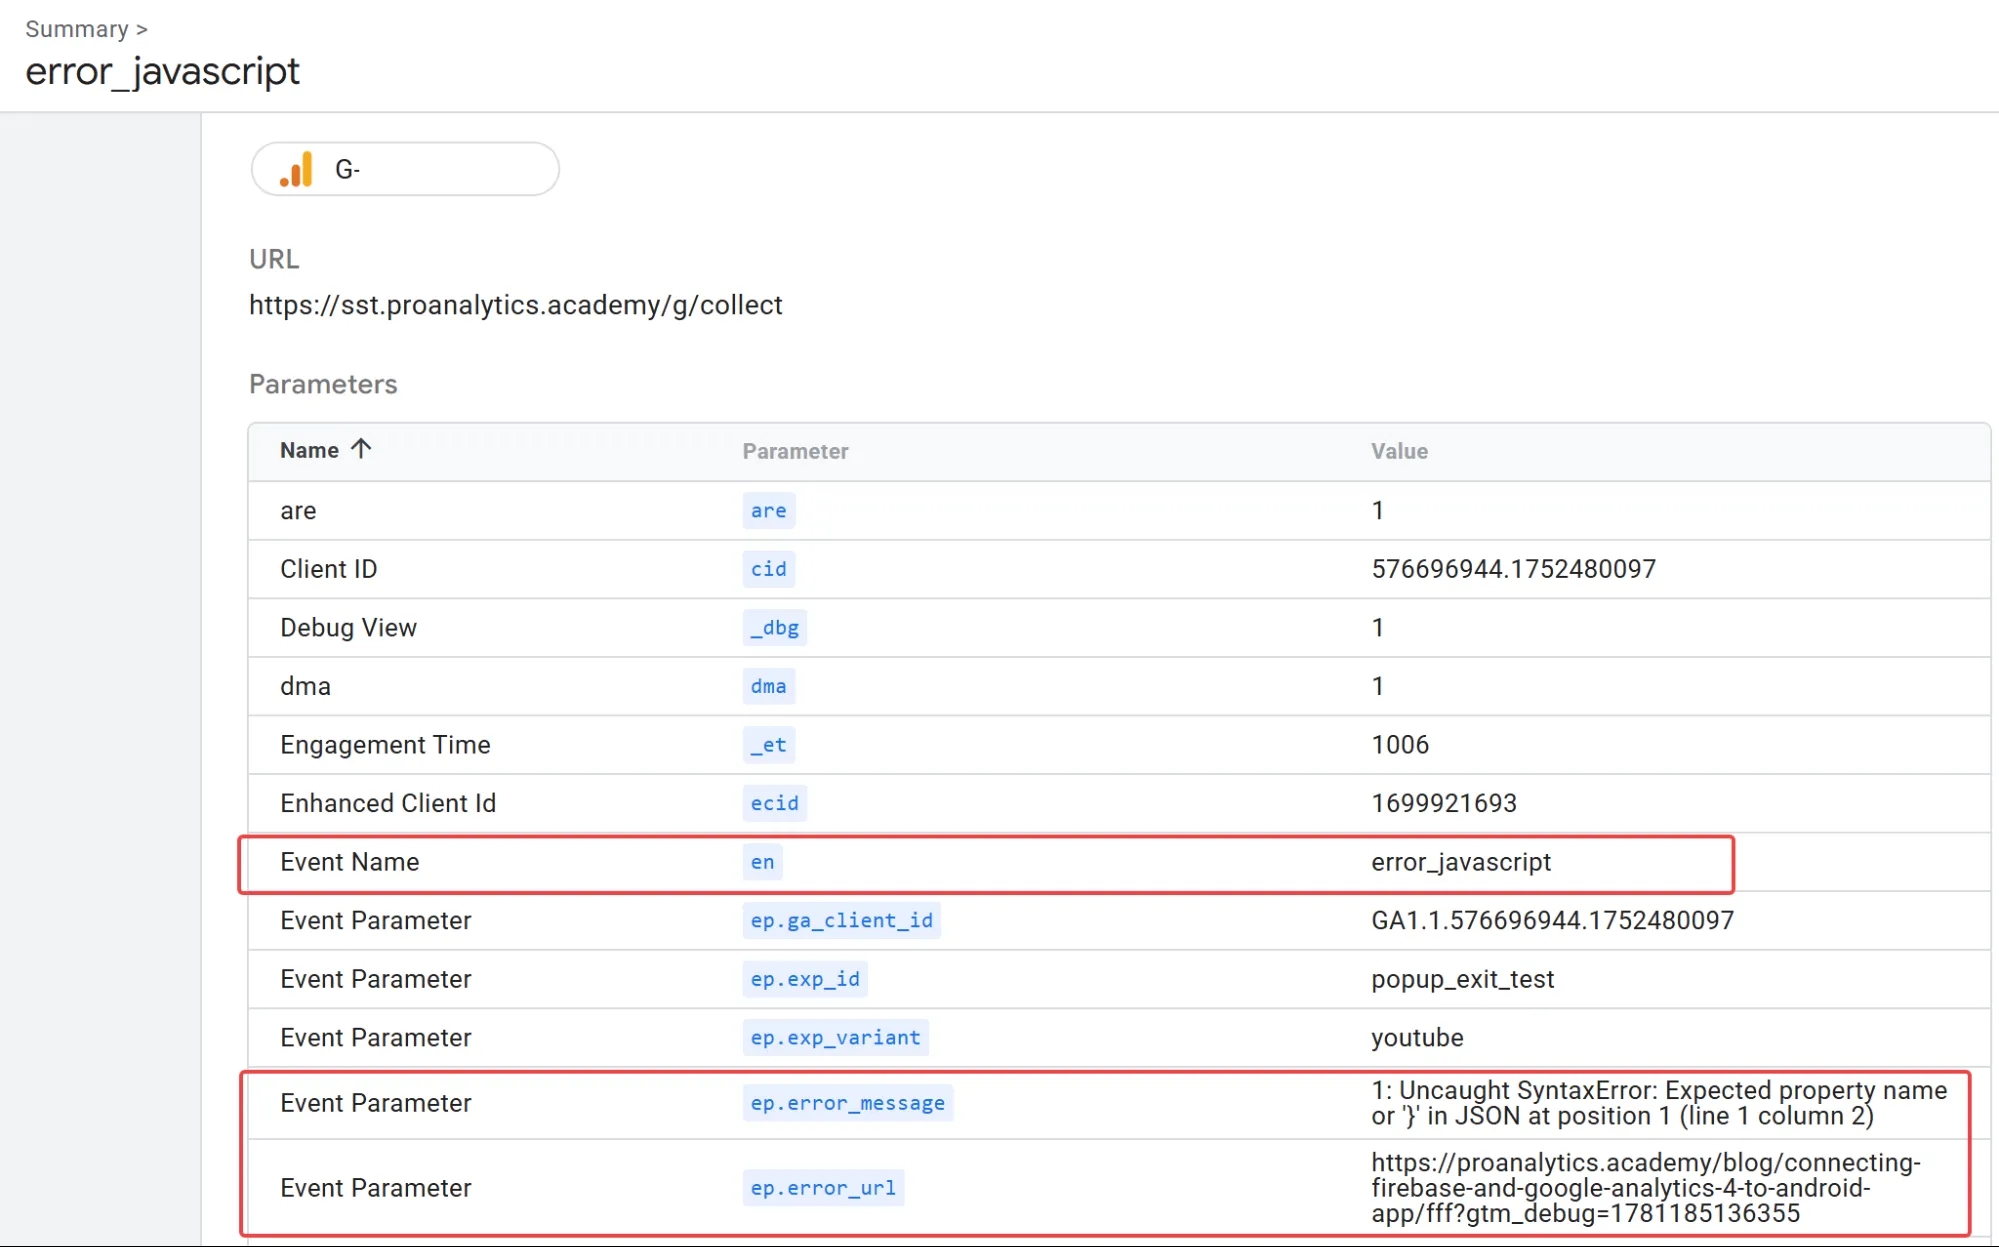
The screenshot below shows an example of the information you'll be able to collect this way. You can then pass it to a developer or an AI agent — though I'd treat that option with some caution for now — for further troubleshooting:
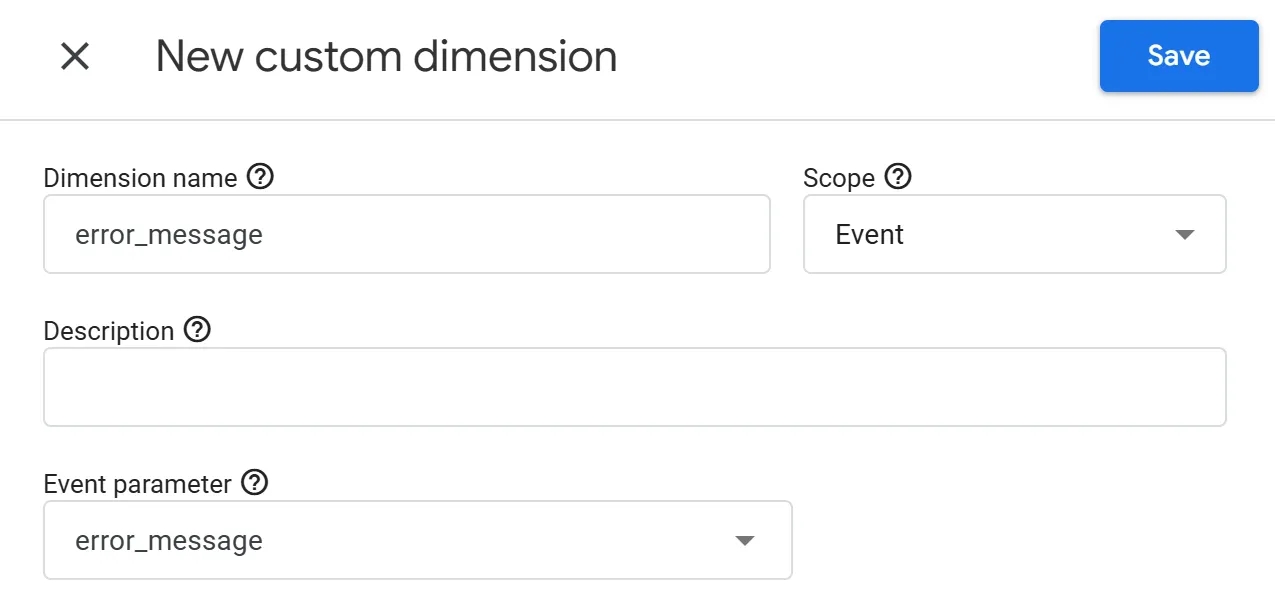
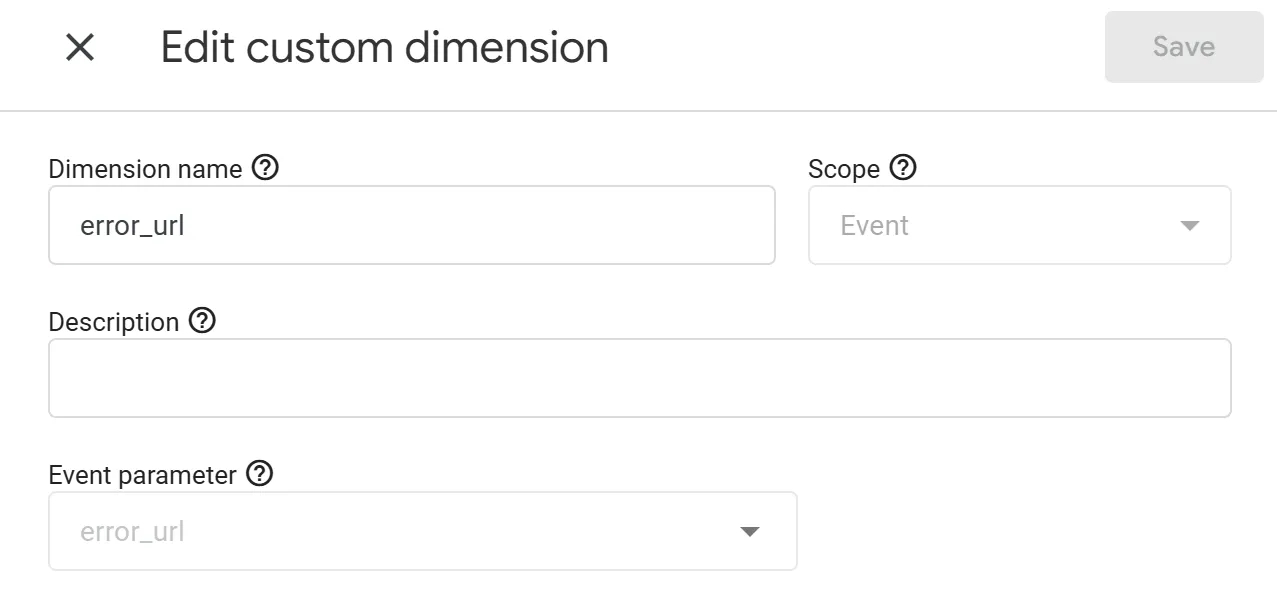
Don't forget to create the corresponding custom parameters in GA4:
Instead of a conclusion
Even this basic tracking setup — which takes about 15 minutes to configure in GTM — can help you spot problems in time that directly affect conversion: broken scripts, page errors, clicks on non-functional buttons, and other situations that lead users to simply leave the site.
In the second part of this material, I take a closer look at error tracking during form interactions — I recommend checking that one out as well.
Loading comments…