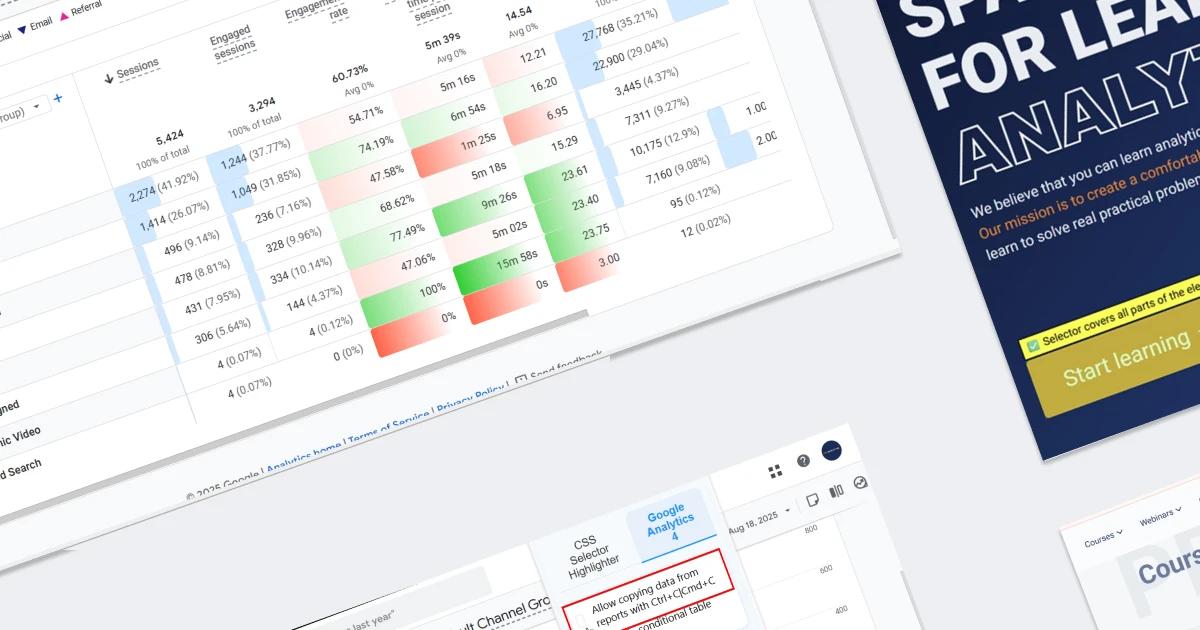

Personally, I really love different Chrome extensions — they significantly expand the browser’s capabilities. But as often happens, some of them eventually lose support from their developers.
The PROANALYTICS extension, which we’ll talk about today, appeared quite by chance, and its initial idea was not new. For a long time, I used an extension that highlighted CSS selectors on a page, and many of my students also used it: it made life easier both in real work and when doing homework. But at some point, that extension was removed from Chrome, and we couldn’t find any new alternatives that fully satisfied us in terms of functionality. That’s why the idea of writing my own version appeared.
Of course, if you’re going to build something, you might as well improve it right away. That’s why the extension doesn’t just highlight elements but also shows whether your selector actually covers all the internal elements. This happened back in 2024.
Although the original idea was to make life easier for students of the PRO GTM course, since then — according to Chrome Store statistics — around 400 users have been using the extension every week.
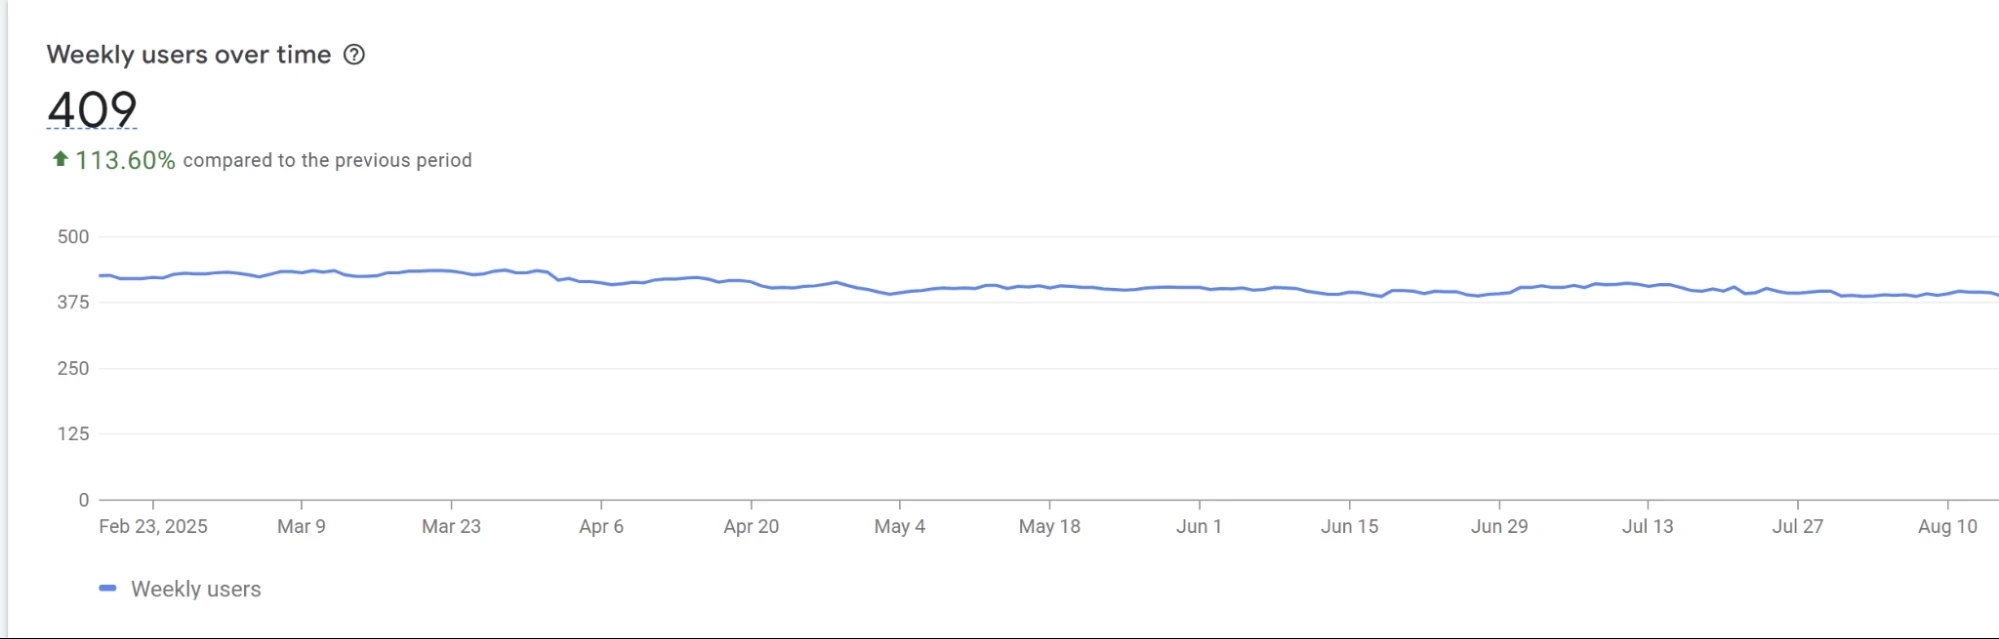
“Not a bad result for software written in just a few hours,” I thought, and decided to add a few more new features.
This blog post is a short overview of the current capabilities of the extension. Hopefully, it will be enough to get to the first 1,000.
What is the PROANALYTICS browser extension
PROANALYTICS is a Chrome extension that makes life easier for marketers, PPC specialists, web analysts, and anyone who works daily with GTM and GA4. It combines several practical functions that help speed up routine actions and make working with data more convenient.
What PROANALYTICS can do
The extension consists of two main blocks: CSS Selector Highlighter and Google Analytics 4. Each has its own specifics, but both are designed to speed up working with data and eliminate unnecessary routine. Let’s start with the first block.
Highlighting elements that match a CSS selector
As I already mentioned, the CSS selector highlighting feature was the first step in creating PROANALYTICS. Here’s how it works:
- When you enter a CSS selector — for example, h3 — the extension instantly highlights all the matching elements on the page.
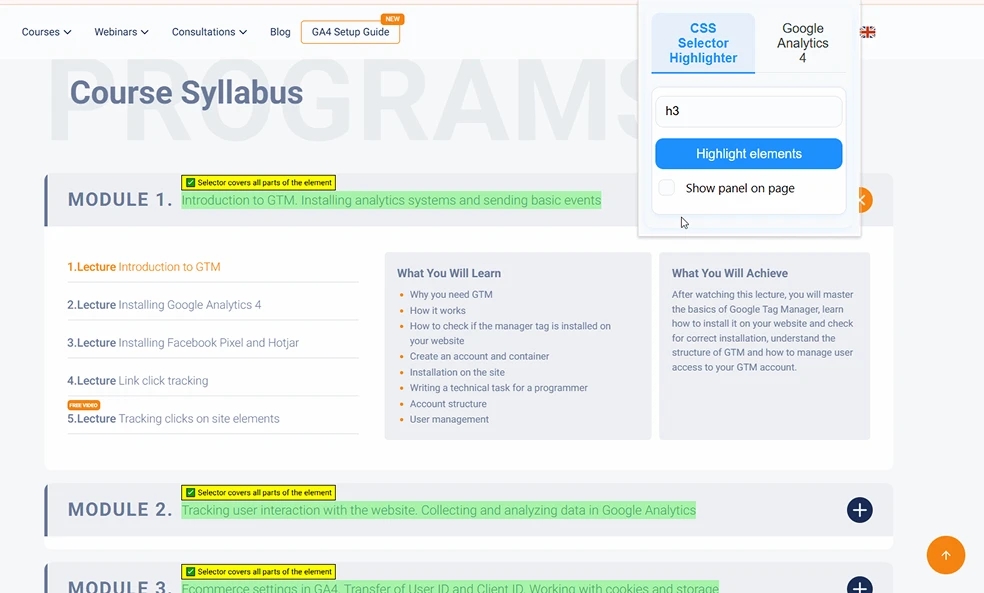
- It also immediately shows the number of matches found.
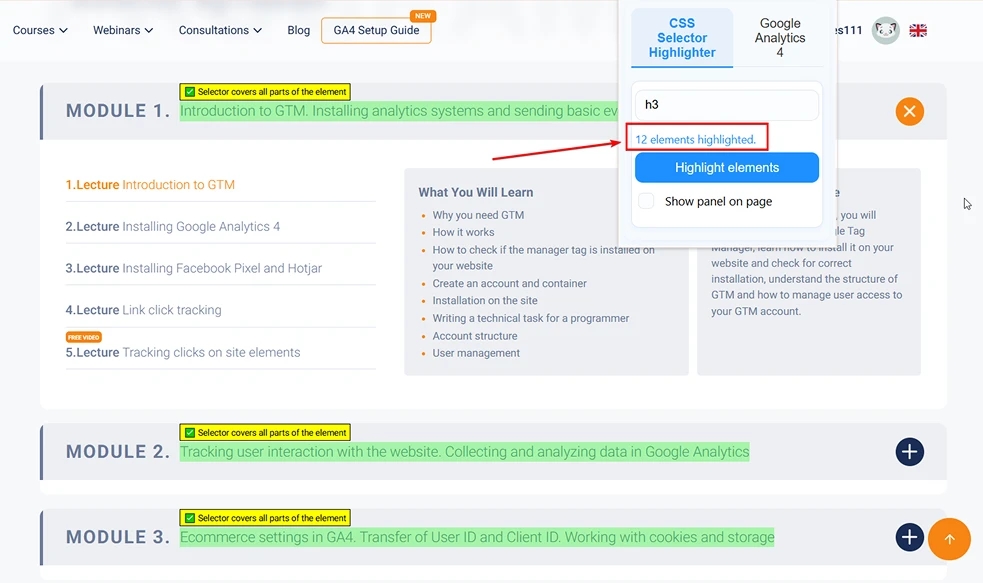
- If one visual element consists of several parts (for example, a button with an icon and a label), the extension shows whether the entire component is covered or just a part of it. This allows you to fine-tune triggers in GTM and avoid missing important parts of an element.
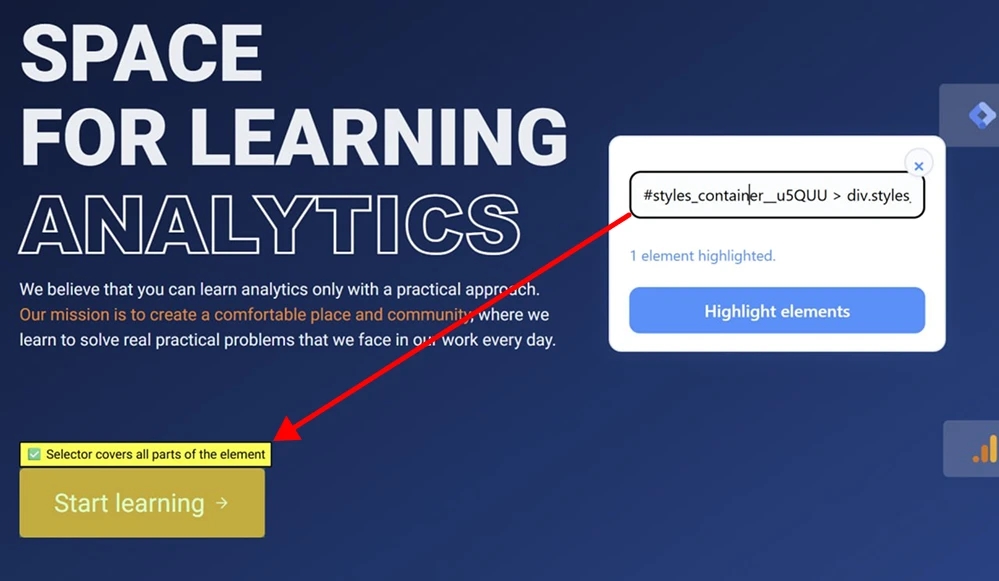
Of course, if your selector doesn’t cover all parts of the button, the extension will also notify you and even highlight in red the part you missed.

- To keep context while working, you can add the extension panel directly to the page using the “Show panel on page” button. In this mode, it doesn’t disappear after a click and lets you test selectors calmly without having to open the extension every time.
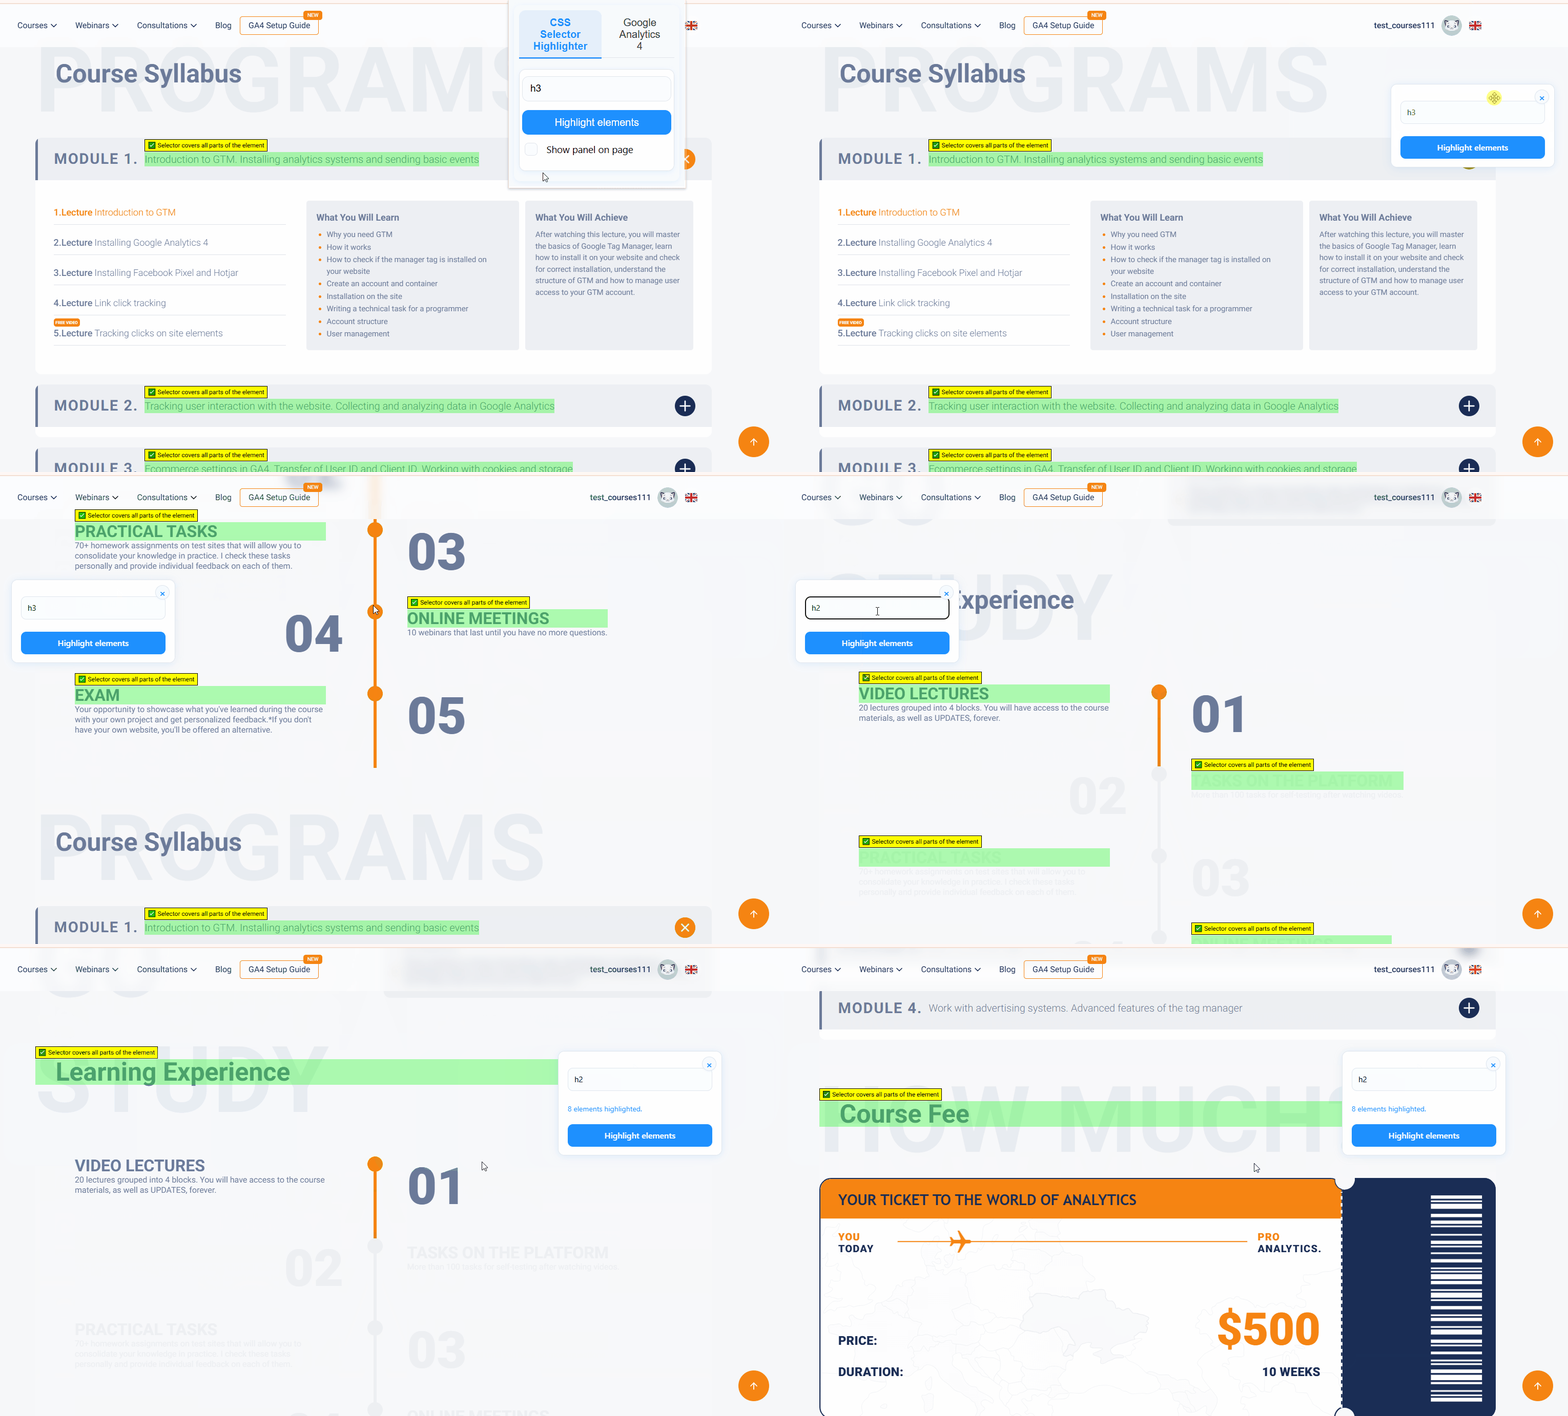
- The last entered selector is saved — even after refreshing the page or switching to another tab.
All this makes working with selectors not only visual but also convenient in everyday practice — especially when you need to quickly check whether tag or event conditions are set up correctly.
Features for Google Analytics 4
The second big function of PROANALYTICS is enhancing GA4 functionality.
Conditional table formatting
The main feature is conditional formatting of data in standard Google Analytics 4 reports. It adds visual cues directly to tables, so you can perceive information more easily without long “digging” into each number.
This feature appeared as a response to the fact that many people still remember the old Da Vinci Tools extension for Universal Analytics, which added “heatmap” highlights in the interface. Since that extension is no longer available, PROANALYTICS brings it back — and even does a bit more.
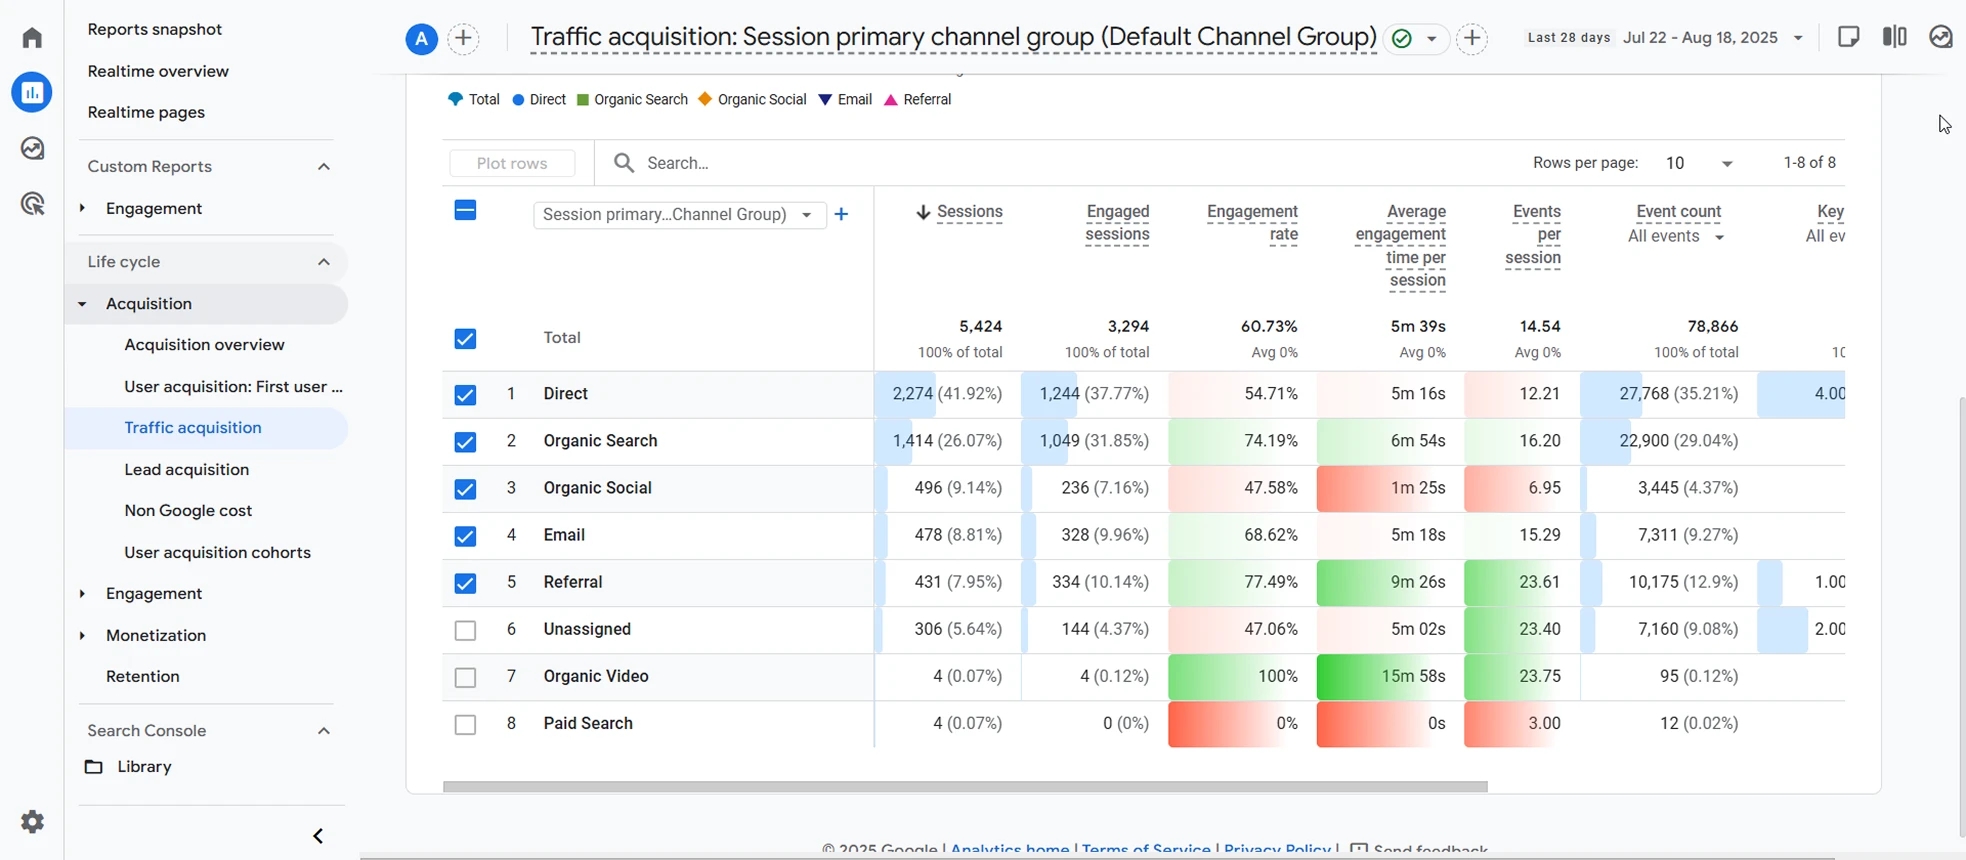
To activate the functionality, simply enable the “Enable conditional table” option:
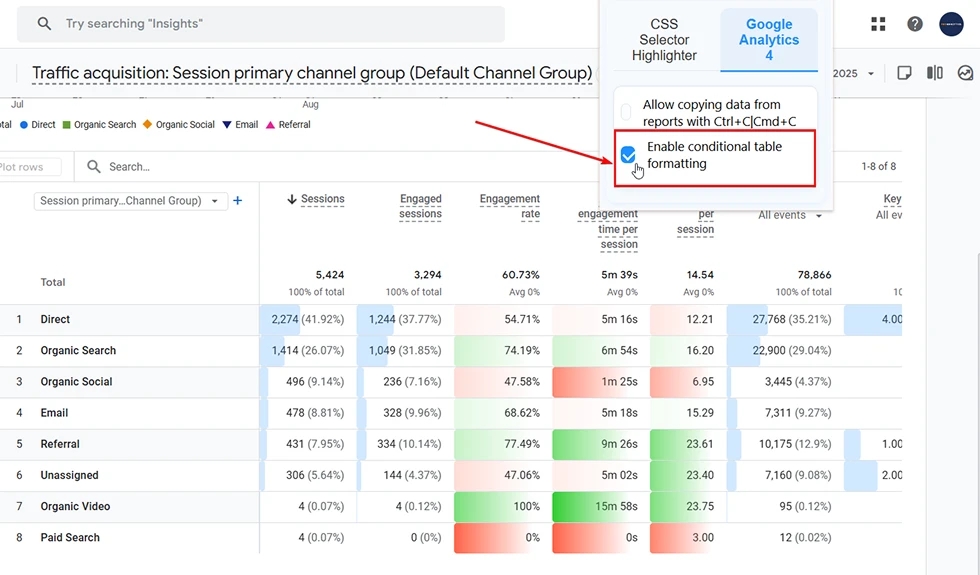
Here’s how it works in detail:
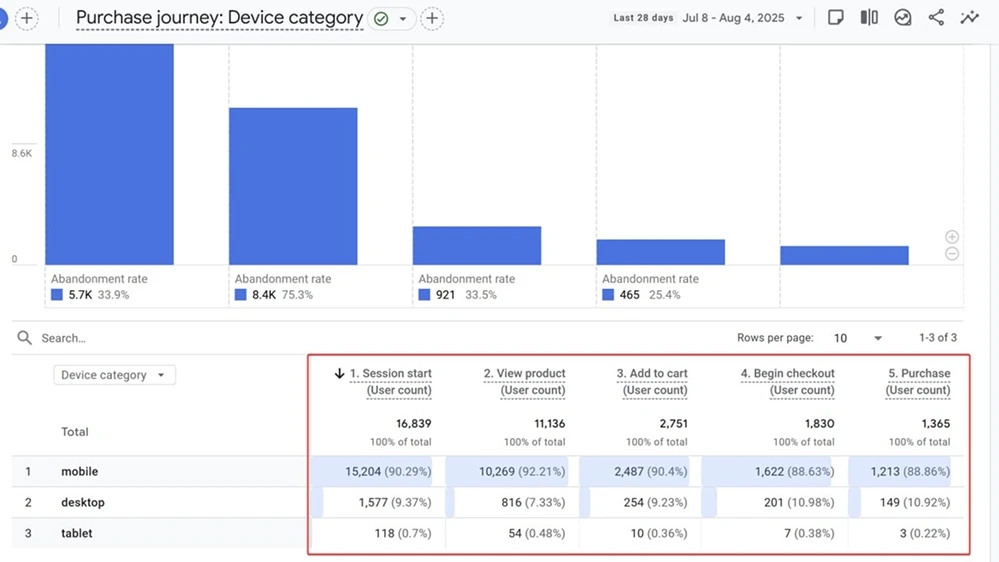
- For absolute metrics (for example, the number of events, sessions, users), horizontal bar charts appear in the cells, showing the share of that row in the total sum. For instance, if in the “Session start” column the value for mobile is 15,204, and the total is 16,839, then the cell is almost completely filled, because that’s more than 90% of the total. For desktop, where there are only 1,577 sessions, the bar will be much shorter.
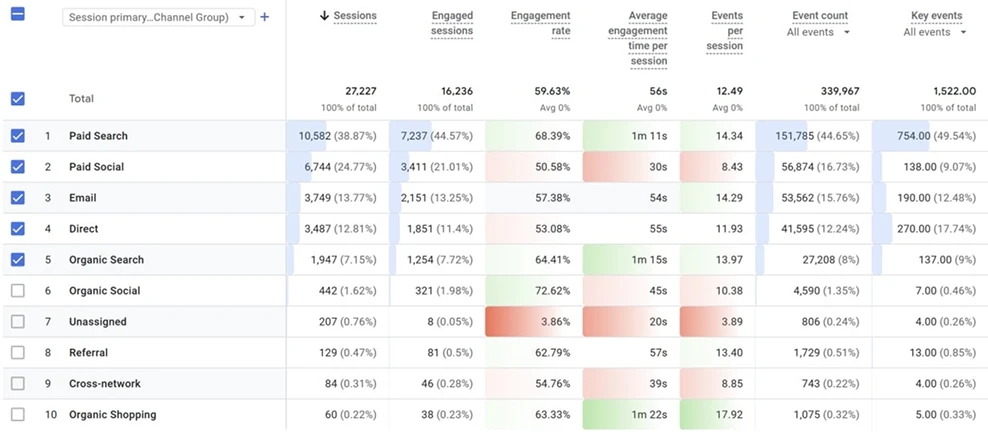
- For calculated (percentage or average) metrics, such as Engagement Rate or Average engagement time, cells change their background depending on how far they deviate from the average value. Let’s take Engagement Rate as an example — in our table, the average is 59.63%.
- If the value is above average, the cell is highlighted green.
For example, in the Organic Social row — 72.62%, which is significantly higher than average, so the background is green. - If the value is below average, the background will be red.
For Unassigned — only 3.86%, so the cell is highlighted red. - If the value differs from the average by less than 5%, no highlighting is applied.
For example, in Email — 57.38%, so that cell looks neutral. - And the further the value is from the average, the brighter the highlighting will be — so you’ll definitely notice it.
- If the value is above average, the cell is highlighted green.
Copying data from the interface
The last feature of the extension may seem like a small thing, but it’s exactly these little things that are often missing in everyday work. It’s about the ability to copy data from GA4 reports using the familiar keyboard shortcut Ctrl+C / Command+C.
In the standard GA4 interface, copying something directly often just doesn’t work. You highlight the text, press Ctrl+C — and nothing ends up in the clipboard. You have to right-click and look for “Copy.” This is inconvenient, especially when you need to quickly transfer several values into a table, presentation, or messenger.
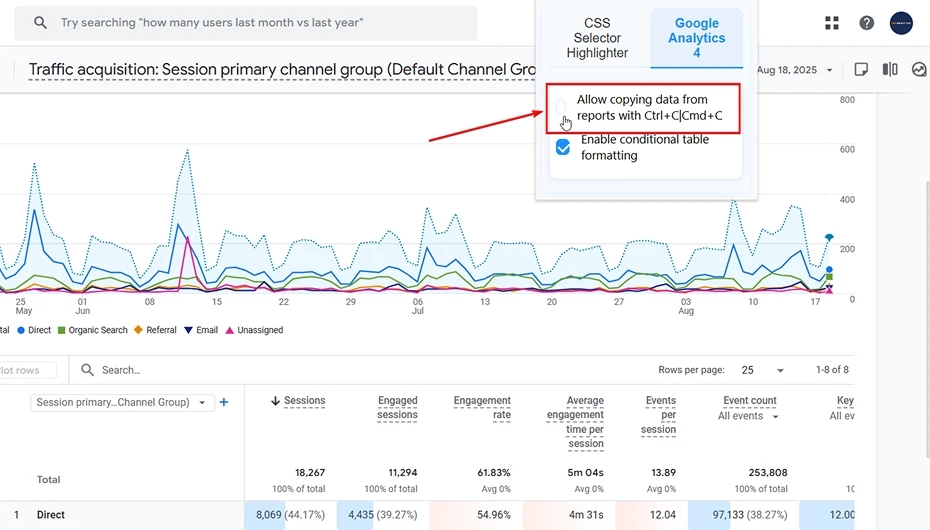
PROANALYTICS solves this problem. Just activate the option “Allow copying data from reports with Ctrl+C | Cmd+C”, and copying starts working simply: highlight — copy — paste.
This is just the beginning
PROANALYTICS helps save time on typical analytics tasks — from checking selectors to working with GA4 reports. And although the extension already covers many daily needs, this is not the final version — it will continue to be updated and improved.
So try it out, test it in your work, and share your feedback: thanks to you, I’ll be able to improve the tool and add even more useful features.
Loading comments…