The Complete Guide to SQL for Google Analytics 4 in BigQuery: From Basics to Advanced Marketing Analytics (Part 1)

The digital analytics ecosystem is evolving rapidly, and along with it, the very approach to working with data is changing. If previously it was possible to “live” entirely inside the Google Analytics interface, today this is no longer enough.
The raw data that GA4 sends to BigQuery provides full control over calculations. But to extract value from it, one key skill is required — SQL.
This guide is a detailed and practical introduction to SQL using raw GA4 data as an example. We will move step by step, with explanations, real-life cases, and query examples.
Part 1: GA4 Export Architecture and Fundamental Operators
- BigQuery data structure: what a table consists of
- Fundamental SQL Operators
Part 2: Calculating the Number of Users and Sessions Using GA4 Export Data in BigQuery
- 2.1 COUNT Function Combined with DISTINCT: User Calculation
- 2.2 CONCAT Operator: how to get a Session ID and calculate the number of sessions using GA4 export data in BigQuery
- 2.3 Nested Fields and the role of UNNEST when working with GA4 data
- 2.4 GROUP BY — breaking calculations down by required parameters
- 2.5 ORDER BY — how to sort results
Part 3: Building the “Pages and Screens” Report
Part 1: GA4 Export Architecture and Fundamental Operators
Before moving on to analyzing user behavior, it is necessary to understand how GA4 stores data inside BigQuery. If this is not understood, queries will either be expensive or incorrect.
Exported data is stored not as aggregated reports, as in the interface, but in the form of raw event records. This means that each row in a BigQuery table represents a single event: a page view, a click, a session start, content interaction, a transaction, and other events sent by your website or application.
That is why, before writing any SQL queries, it is important to understand:
- what structure GA4 export tables have;
- which fields are available in them;
- which of these fields are nested structures;
- how to combine daily tables into a single query, and much more, which we will discuss further.
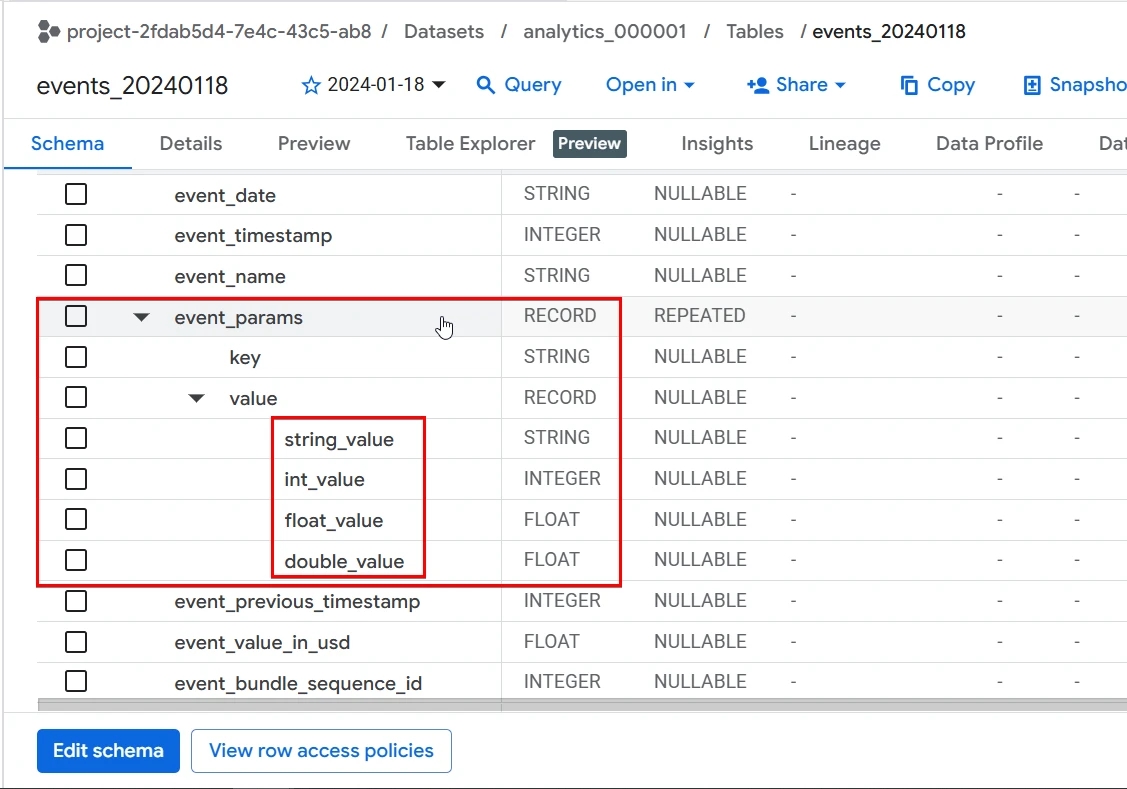
BigQuery data structure: what a table consists of
After setting up the GA4 export to BigQuery, you get a dataset in which a separate table is created for each day in the following format:
events_YYYYMMDD
To understand how to reference this table in SQL, it is important to know the general BigQuery hierarchy: Project > Dataset > Tables.
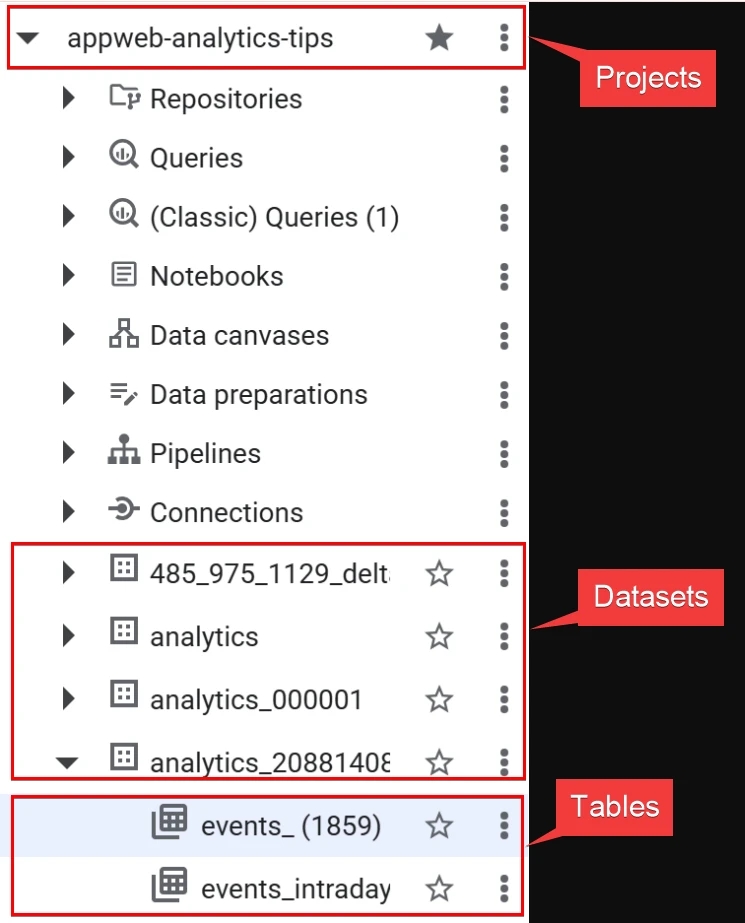
n the case of GA4, the dataset always has the name analytics_{ga4_property_id}, and the tables are named events_YYYYMMDD. In other words, each table contains events for a single day.
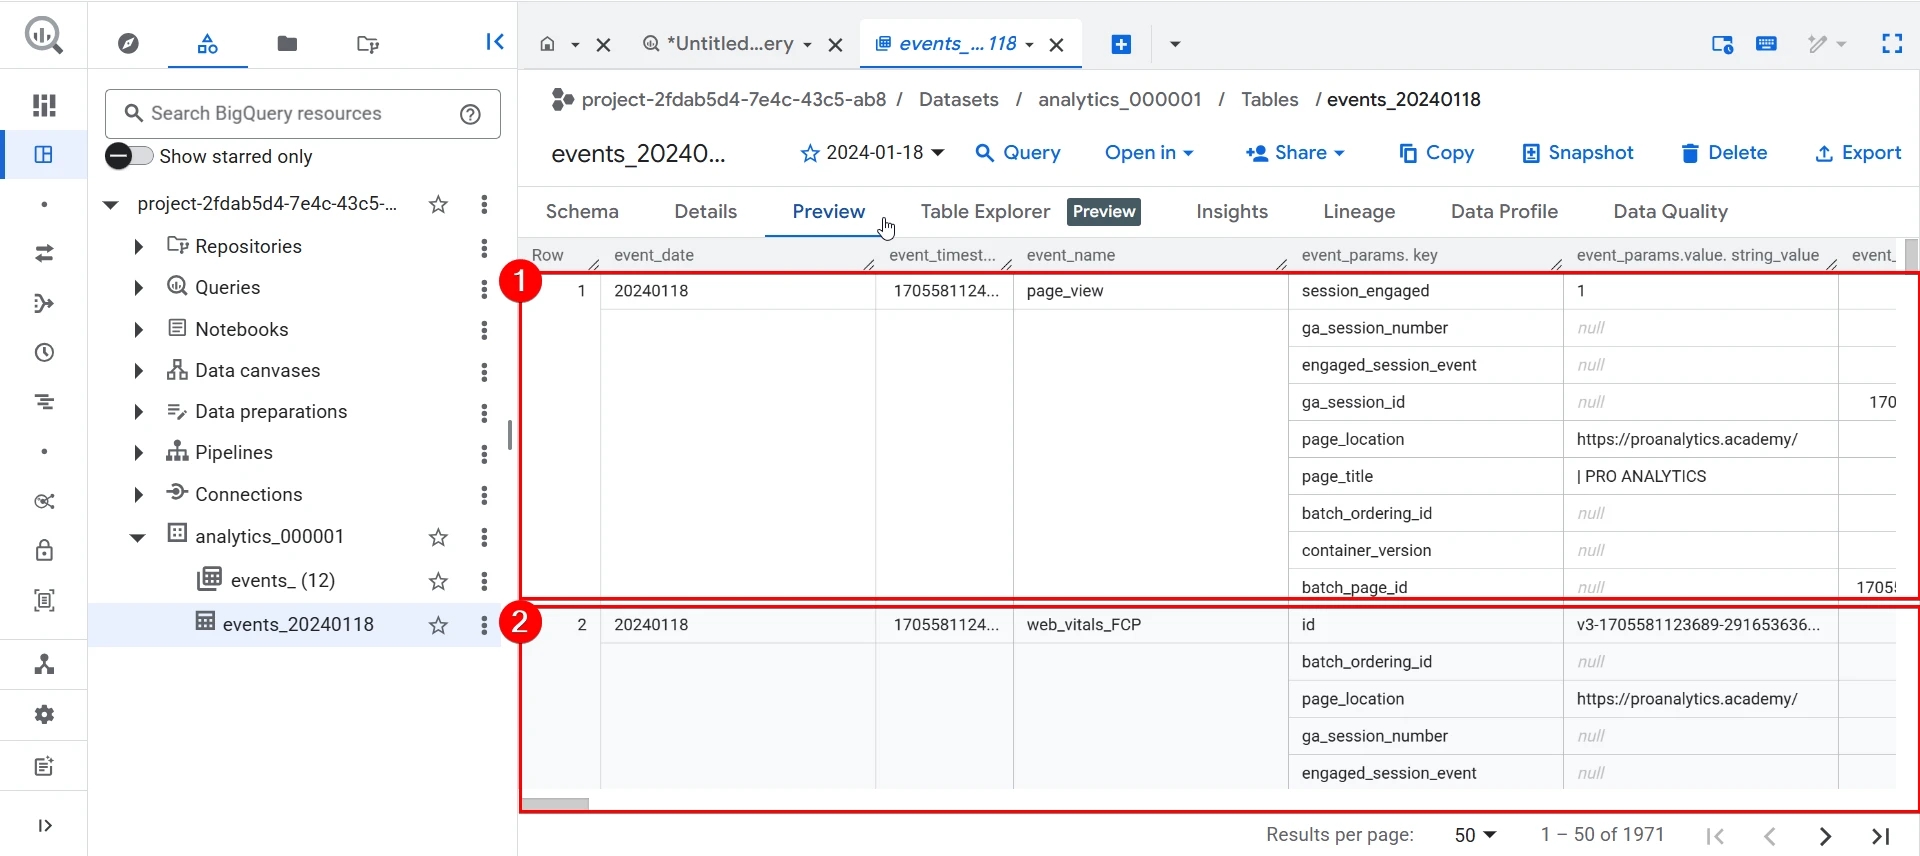
When you open any of these tables in BigQuery, the SCHEMA is displayed on the right side of the interface — a complete list of all available fields. At first glance, it may look like a regular table, but the structure is much more complex: in some cases, for example with event_params, you can see additional nesting.

As can be seen from the schema, the table contains a large amount of diverse information. Below is just an example of data for a single event:
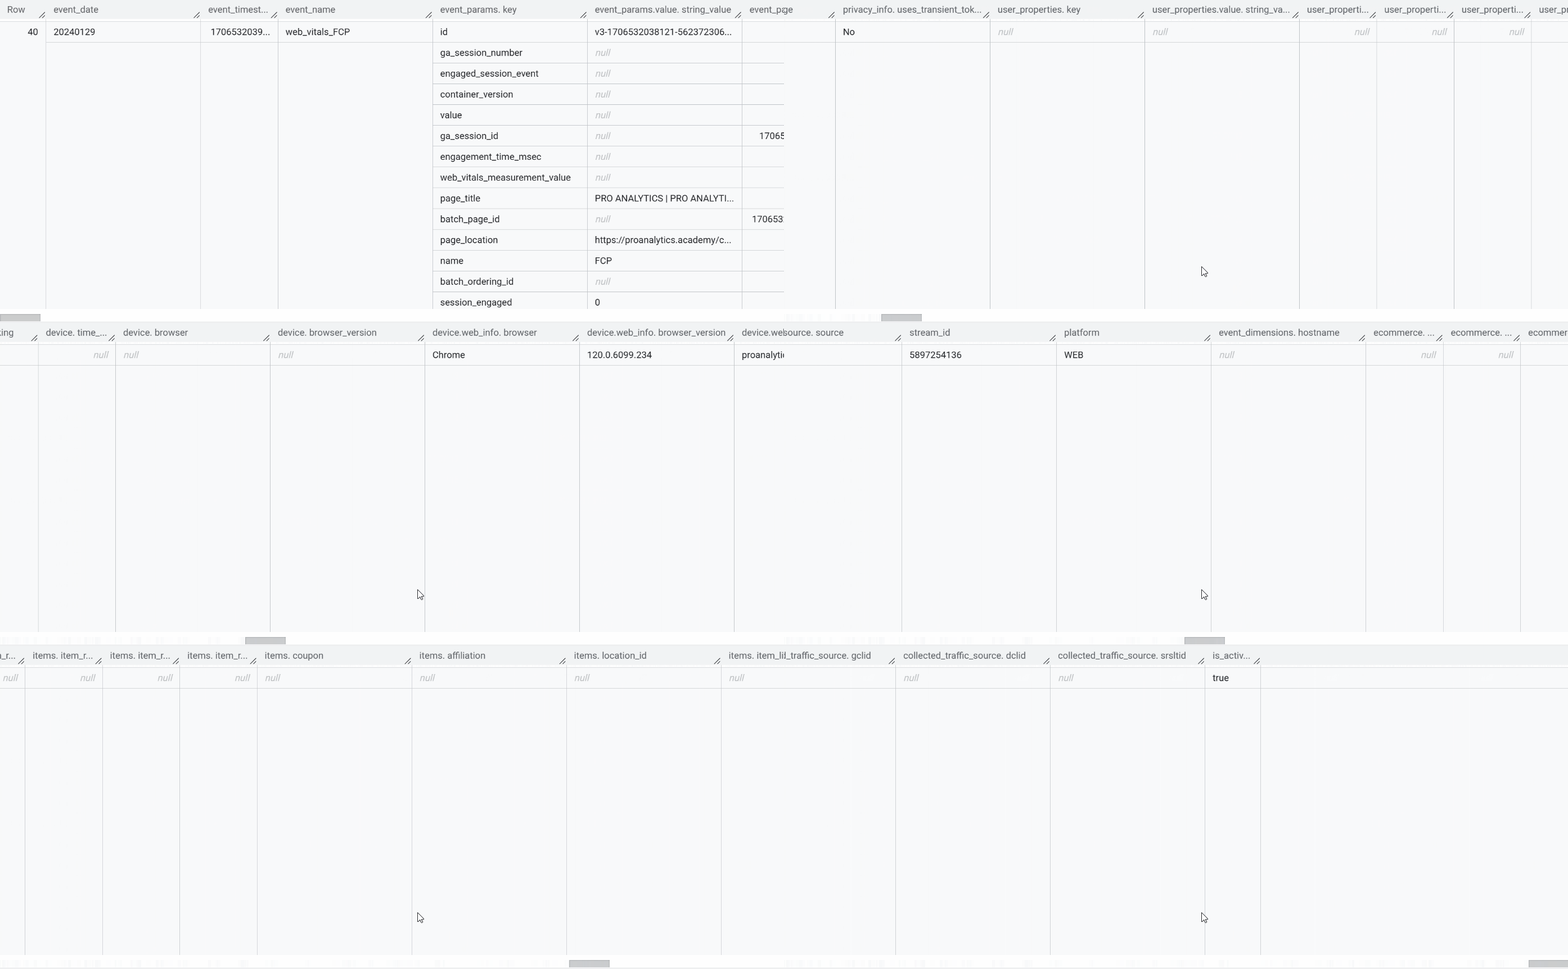
Among the fields we will work with most often are:
- event_date — the event date in the GA4 time zone;
- event_timestamp — the exact event timestamp in UNIX format;
- event_name — the name of the event;
- event_params — an array of parameters that may contain the page URL, UTM tags,
session_id,screen_name, and other values; - user_pseudo_id — a unique user identifier;
- traffic_source — the source, medium, and campaign of the traffic through which the user first visited the site;
- device, geo — sets of nested fields with device and geo data.
The official Google documentation provides a full description of the GA4 export schema, including data types and their nesting. I recommend referring to it whenever you work with new parameters or look for specific values.
Now that you have a basic understanding of the data schema, let’s write our first queries.
Fundamental SQL Operators
1.1 SELECT Operator: how to select only the required data
The SELECT operator is a fundamental part of any SQL query. Its task is to define exactly which information should be returned from a table. The full syntax can be complex, but at a basic level it looks like this:
SELECT list of table fields you want to output
FROM table
We will discuss the FROM operator later.
Selecting all table fields
In the simplest case, the SELECT operator is used together with the special symbol *, which means “all table fields”:
SELECT *
FROM `project-2fdab5d4-7e4c-43c5-ab8.analytics_000001.events_20240118`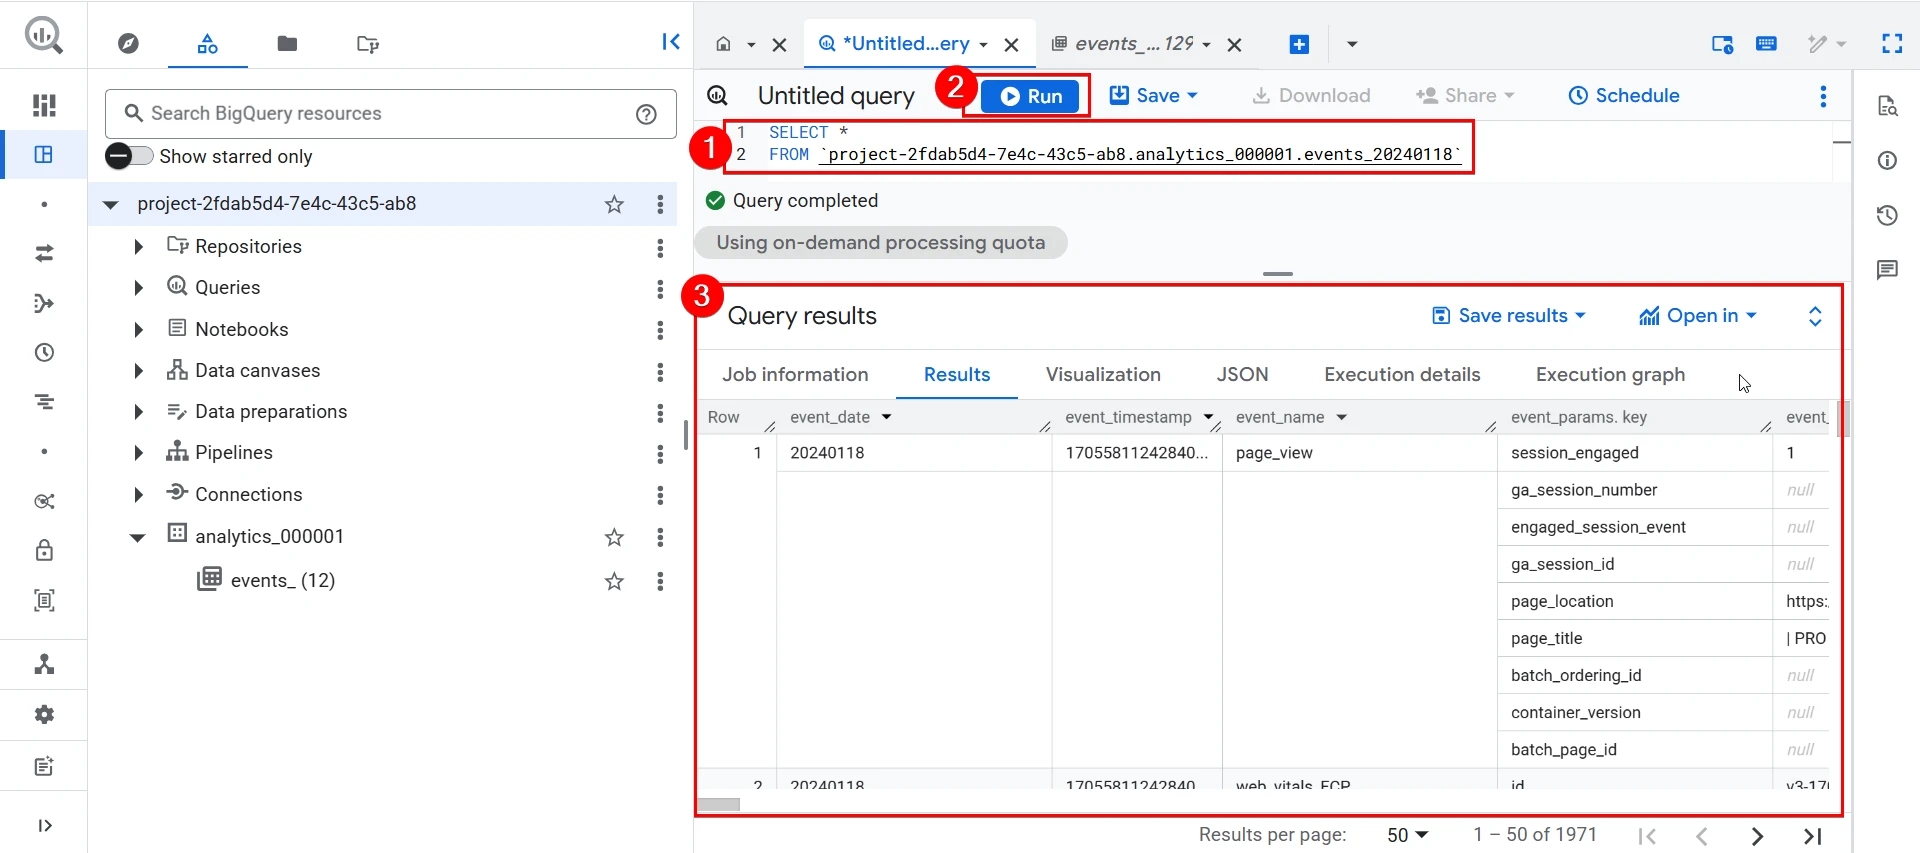
This query returns the full structure of the table — all fields, including nested arrays and RECORD structures, which we will discuss later.
In practice, of course, such a query does not make much sense except for explaining the basics, since you can see a similar view in the BigQuery Preview tab.
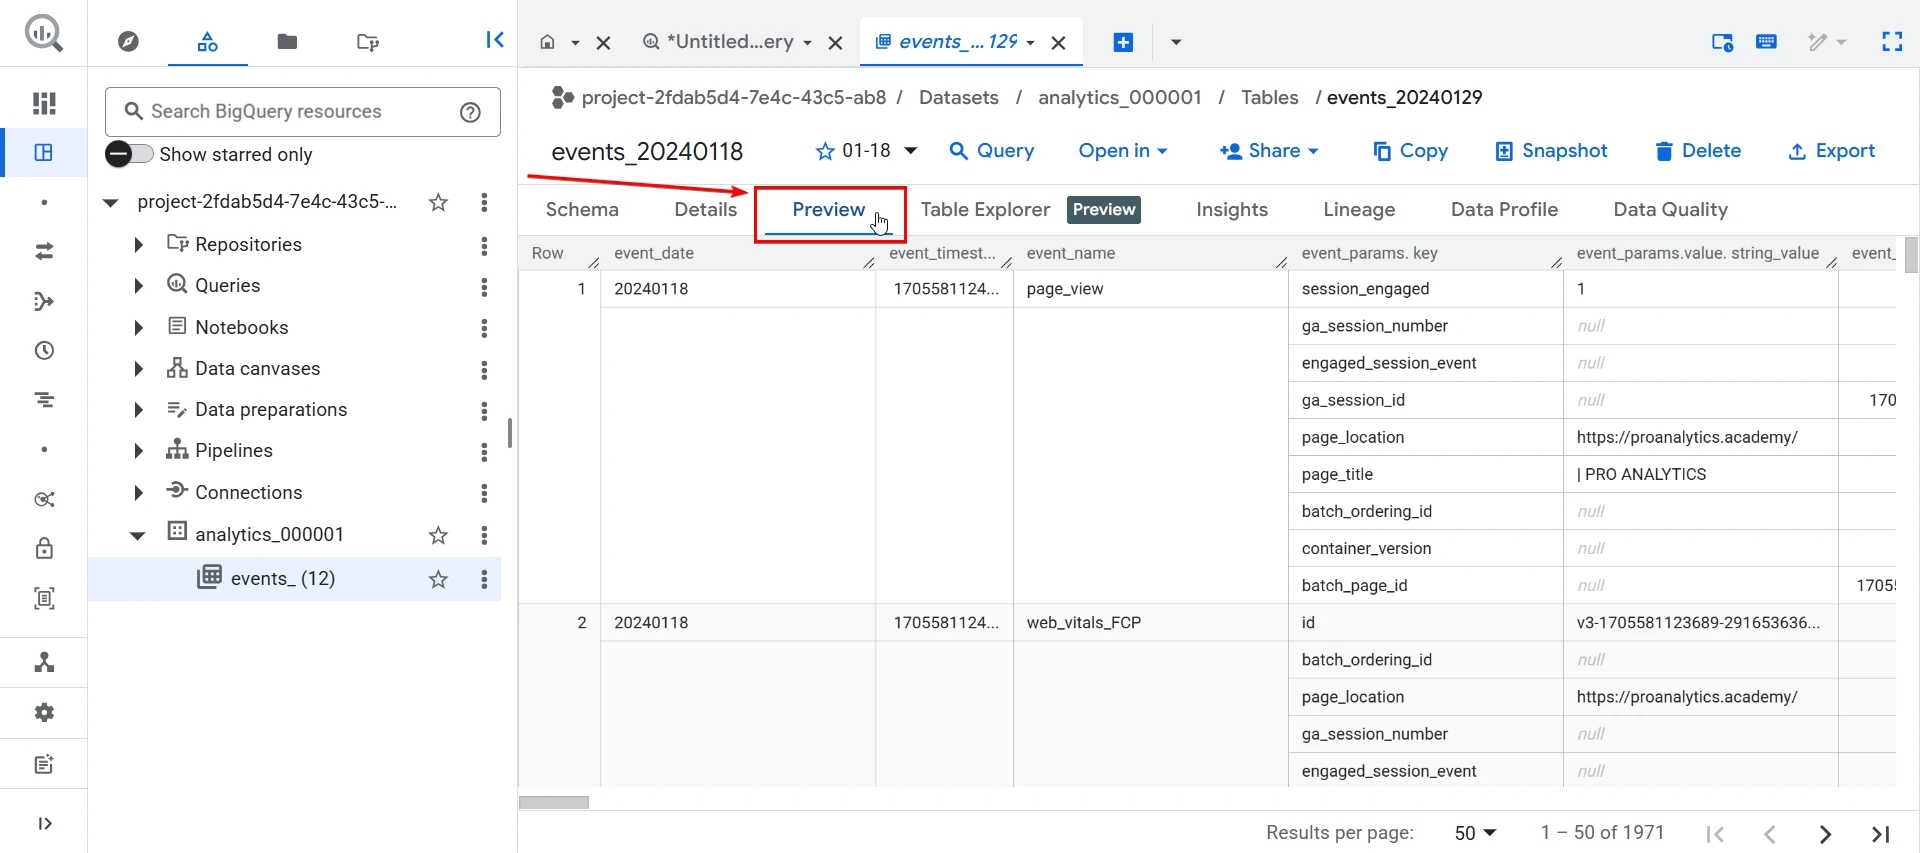
In real-world tasks, it is better to explicitly specify which fields are needed. That is why we now move on to more precise field selection.
Selecting specific fields
To get only the required columns, you simply list their names in the SELECT clause. For example, with the following query, I can get only the event name and the date when it occurred:
SELECT
  event_name,
  event_date
FROM `project-2fdab5d4-7e4c-43c5-ab8.analytics_000001.events_20240118`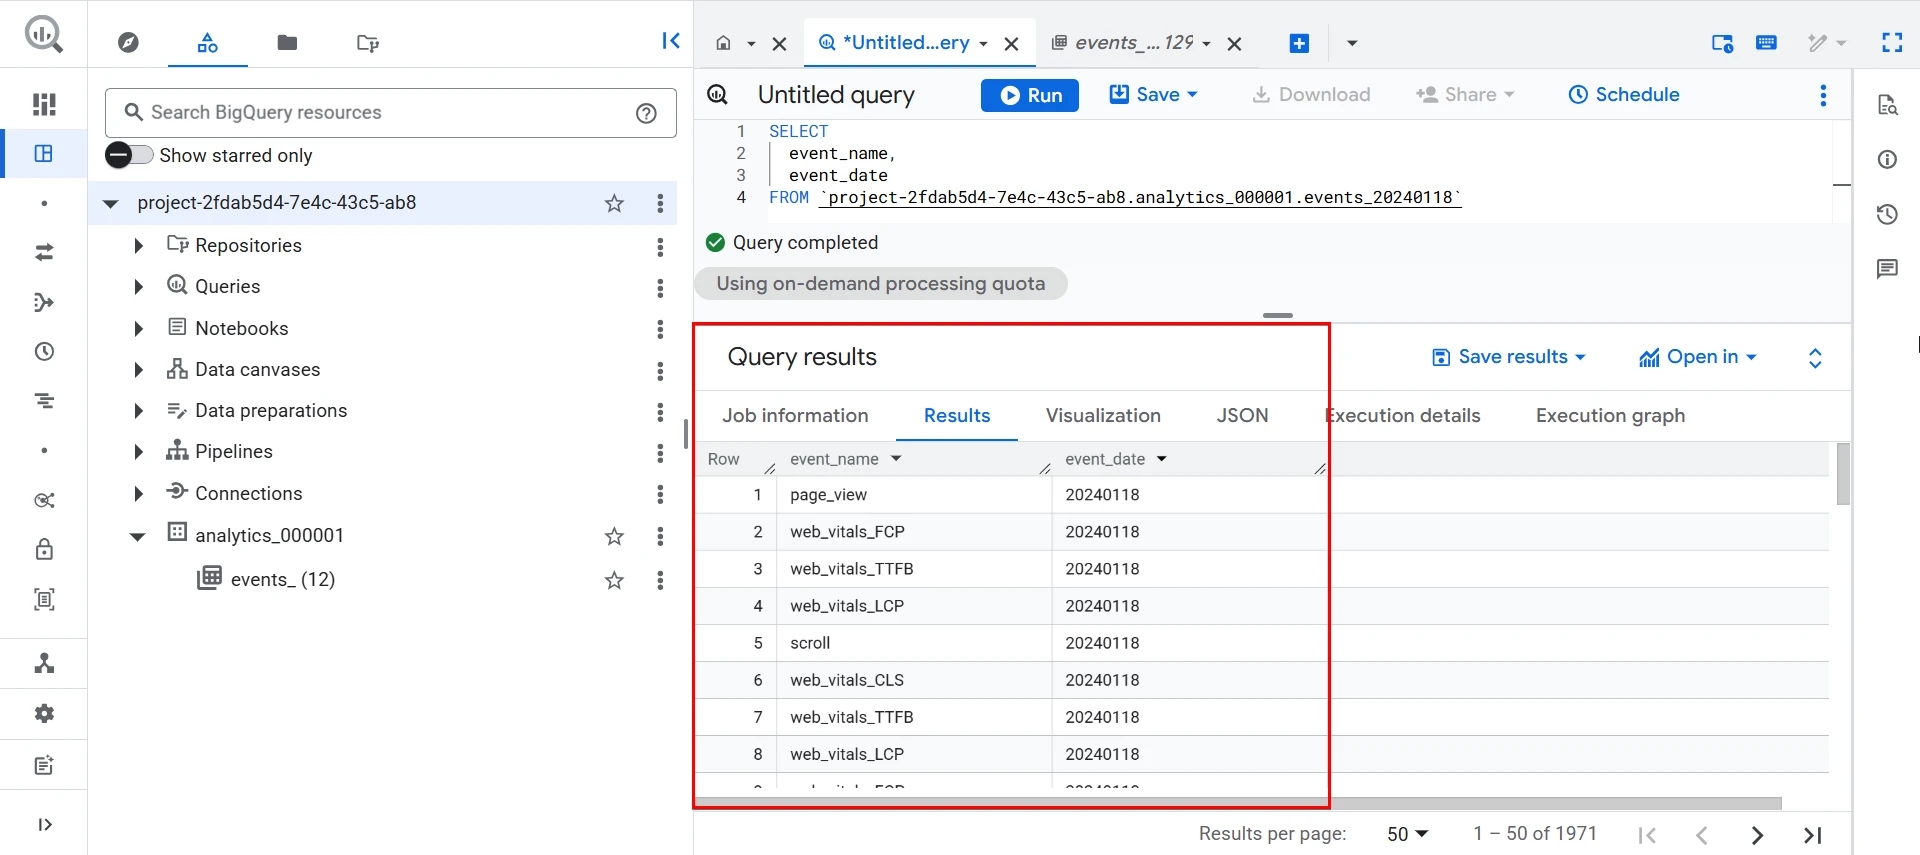
After running this query, or simply looking at the screenshot above, you might have the following question:
Why are there many identical rows in the result?
The answer is simple: because SELECT returns all values from the selected columns exactly as they exist in the table. If the table contains 300 events that occurred on the same day, SELECT will return 300 rows.
If you need to get only unique values, you should additionally use DISTINCT.
DISTINCT Operator
DISTINCT allows you to retrieve unique values of a field or unique combinations of values from multiple fields. Let’s try to get all possible combinations of traffic source and medium through which users first visited our site:
SELECT DISTINCT
  traffic_source.source,
  traffic_source.medium
FROM `project-2fdab5d4-7e4c-43c5-ab8.analytics_000001.events_20240118`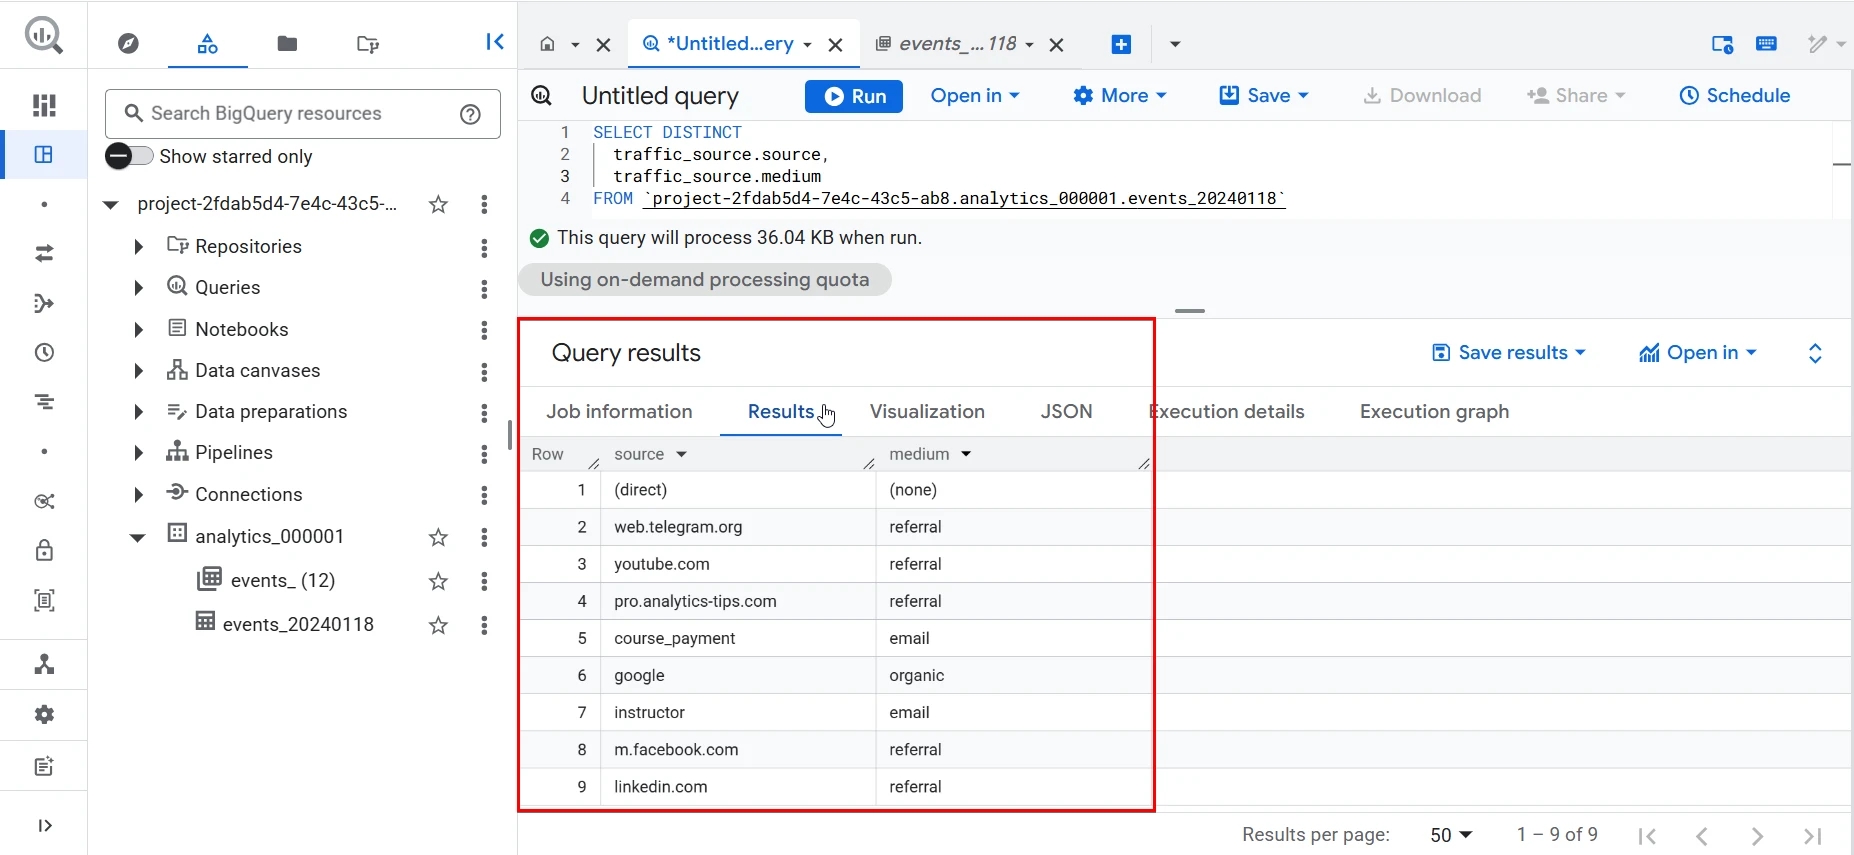
This allows you to see:
- which sources are present in the table;
- which source + medium combinations occurred.
Important: DISTINCT applies to the entire list of fields after SELECT.
Why are field names sometimes written with a dot?
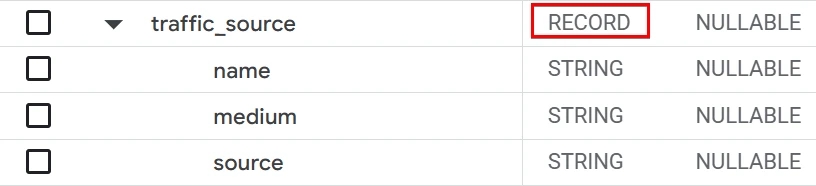
In GA4 tables, some data is stored not as separate columns, but as nested structures that contain other fields inside them. BigQuery allows you to access internal values using dot notation. Thus:
traffic_sourceis a single table field (column) that contains other parameters inside it;traffic_source.sourceis a specific nested value inside that field;traffic_source.mediumis another reference to a different internal value.
In other words, dot notation is simply a way to “reach” the required parameter inside a complex structure.
1.2 FROM Operator
The FROM operator defines where exactly BigQuery should take the data for the query from. In the context of GA4 exports, it works very straightforwardly: we specify the exact table or tables from which we want to retrieve data. In BigQuery, as discussed above, the structure is always the same:
Project → Dataset → Table
That is why in FROM we always see a path like:
project-2fdab5d4-7e4c-43c5-ab8.analytics_000001.events_20240118This means:
- project-2fdab5d4-7e4c-43c5-ab8 — the project;
- analytics_000001 — the dataset;
- events_20240118 — the table with events for January 18, 2024.
Since BigQuery is a paid service with free limits, before continuing with the core SQL operators, it is important to understand the pricing model.
Cost of SQL queries in BigQuery
Every time you write a SQL query, the system calculates how many bytes of data will be processed to execute it. These are the bytes you pay for. In other words, BigQuery operates on a “pay-as-you-go” model.

At the same time, the service provides a basic free monthly quota, which is usually sufficient for small businesses. Specifically:
- 1 TiB of data processing for SQL queries;
- 10 GiB of data storage in tables.
Since these quotas are renewed monthly, they typically fully cover the data analysis needs of small projects. For large companies, BigQuery costs, although they may amount to several hundred or even thousands of dollars, remain predictable, because charges apply only to the actual volume of data processed or stored. Official pricing information is available in the Google Cloud documentation.
1.3 WHERE Operator: Filtering and Resource Optimization
The WHERE operator is used to select from a table only those rows that match a specific condition. The easiest way to think about it is as the equivalent of a filter in Excel or Google Sheets: you specify a field and a condition — and as a result, you get only the rows you need.
This is a key tool when working with BigQuery, because GA4 tables contain thousands and millions of events, and without filtering, analysis is practically impossible. Let’s go through a few examples of how to use this operator.
Value comparisons: >, <, !=
The simplest query with filtering looks like this:
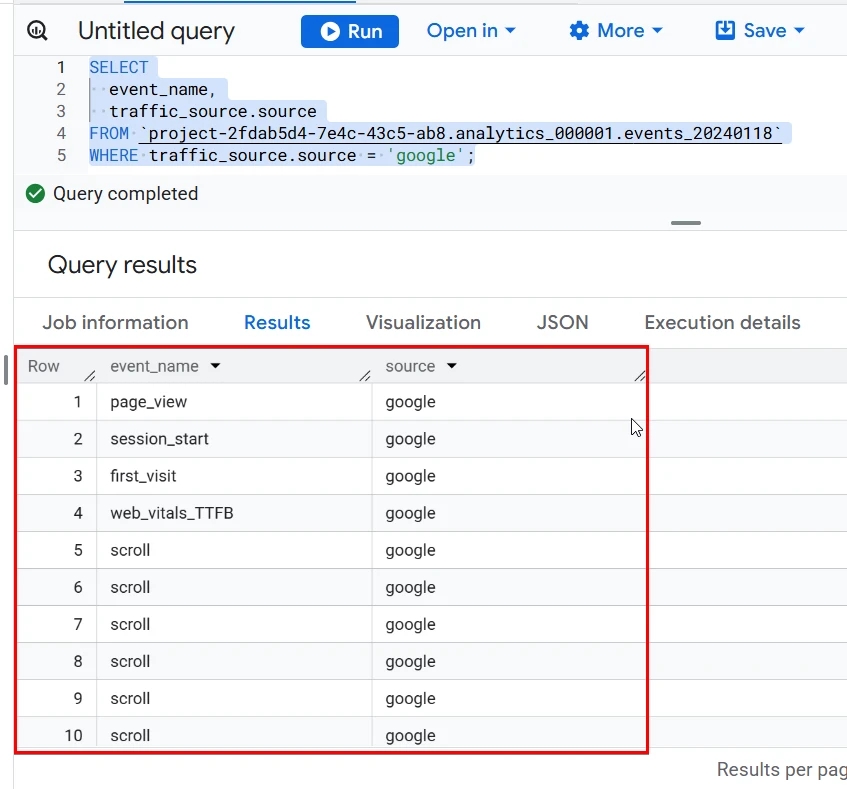
SELECT
  event_name,
  traffic_source.source
FROM `project-2fdab5d4-7e4c-43c5-ab8.analytics_000001.events_20240118`
WHERE traffic_source.source = 'google';
And as a result, we will get a table only with those events where the traffic source (through which the user first visited the site) equals “google”.
In the same way, you can exclude certain values using the “not equal” condition (!=):
SELECT
  event_name,
  traffic_source.source
FROM `project-2fdab5d4-7e4c-43c5-ab8.analytics_000001.events_20240118`
WHERE traffic_source.source != 'google';
At the same time, WHERE can work not only with text, but also with numbers or dates, thanks to the operators >, <, >=, <= .
Filtering with multiple conditions
Conditions can be combined with AND (all must be true) or OR (at least one must be true):
SELECT
  event_name,
  traffic_source.source,
traffic_source.medium
FROM `project-2fdab5d4-7e4c-43c5-ab8.analytics_000001.events_20240118`
WHERE traffic_source.source = 'google'
  AND traffic_source.medium = 'organic'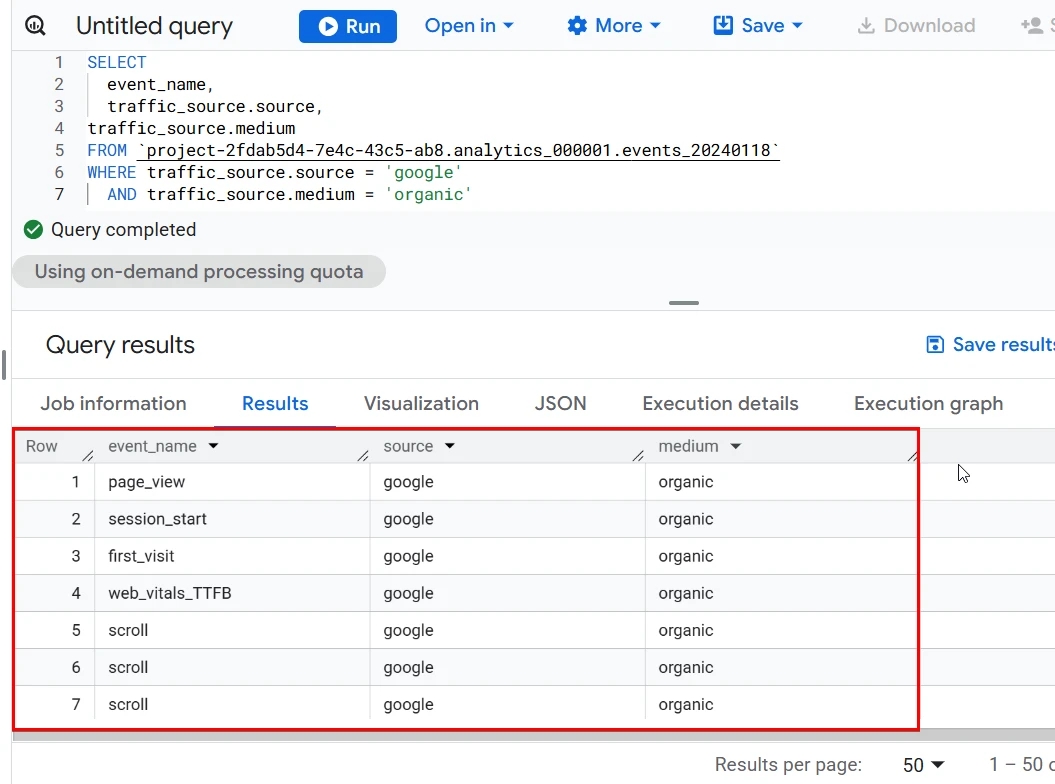
Filtering by part of a word: LIKE operator
Sometimes you need to find all rows where a field contains a specific fragment of text. For this, the LIKE operator is used:
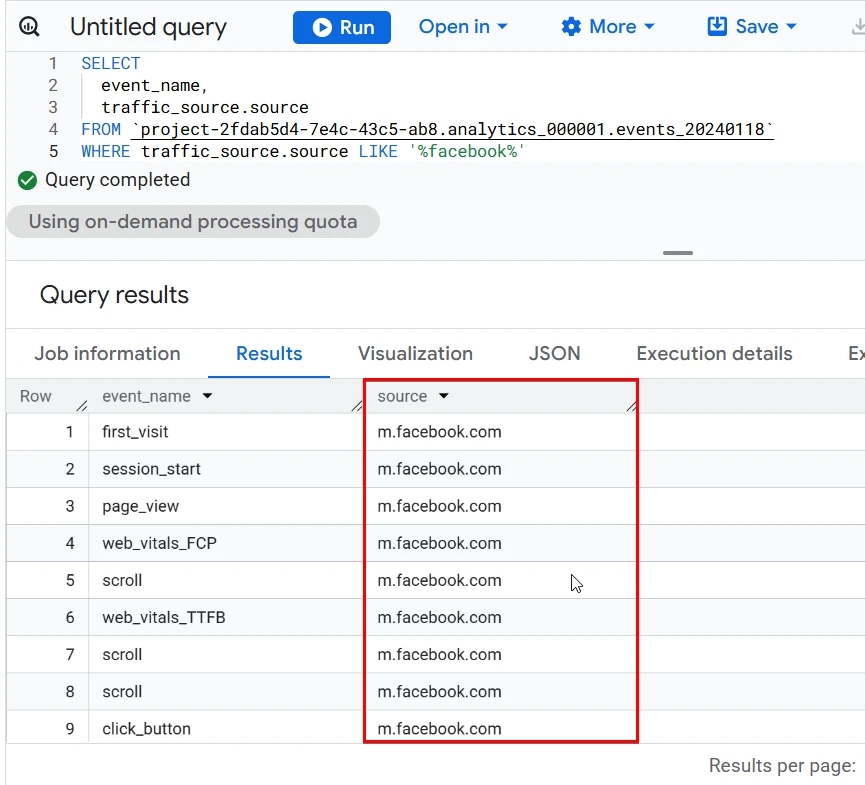
SELECT
  event_name,
  traffic_source.source
FROM `project-2fdab5d4-7e4c-43c5-ab8.analytics_000001.events_20240118`
WHERE traffic_source.source LIKE '%facebook%'
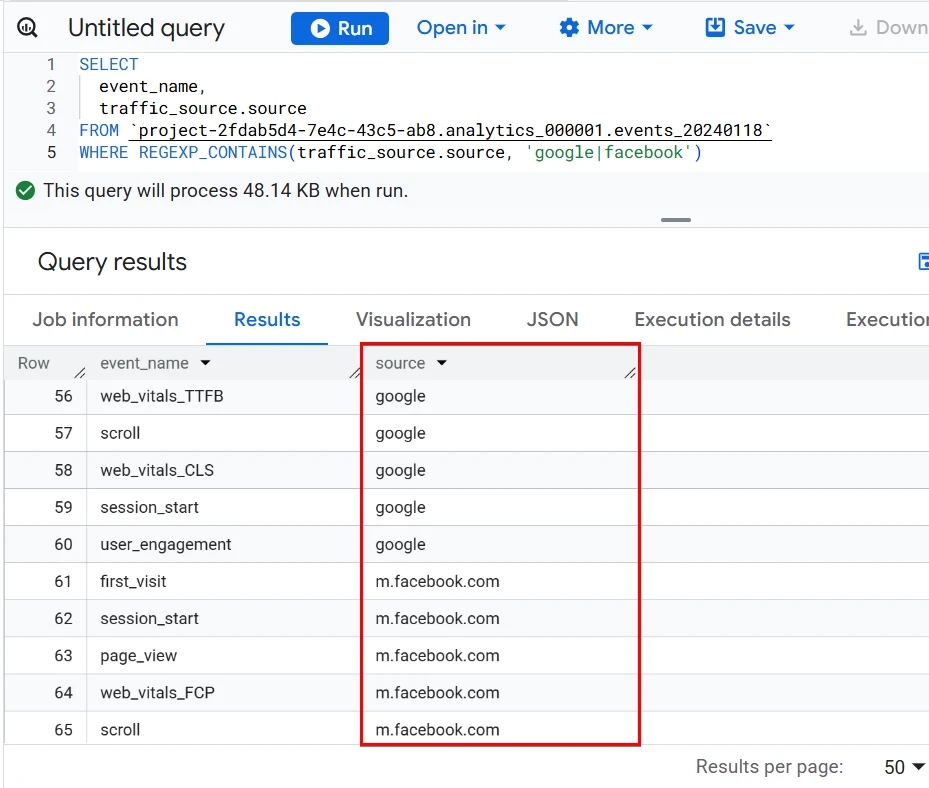
The % symbols mean “any number of any characters”. So as a result, we will return all variations of the facebook source: m.facebook, lm.facebook, etc.:
Filtering with regular expressions (REGEX)
And if simple conditions are not enough — you can always use regular expressions via REGEXP_CONTAINS. For example, in this case we will return all events where the traffic source is related to google or facebook:
SELECT
  event_name,
  traffic_source.source
FROM `project-2fdab5d4-7e4c-43c5-ab8.analytics_000001.events_20240118`
WHERE REGEXP_CONTAINS(traffic_source.source, 'google|facebook')
So, LIKE works well for simple text patterns (“contains”, “starts with”, “ends with”), while REGEXP_CONTAINS supports full regular expressions for complex search conditions: alternatives, patterns, length, character classes, and word-based matching.
Date filtering (_TABLE_SUFFIX)
And now the most interesting part: in BigQuery, GA4 data is stored as daily tables, for example: events_20240101, events_20240102, events_20240103. The part after the underscore (20240101) is the table suffix.
To query multiple tables within one dataset whose names start the same way, you use a wildcard pattern in FROM: events_*, for example:
SELECT *
FROM `project.dataset.events_*`
If you need to select data only for a specific period, you place the asterisk after the date:
SELECT *
FROM `project.dataset.events_202401*`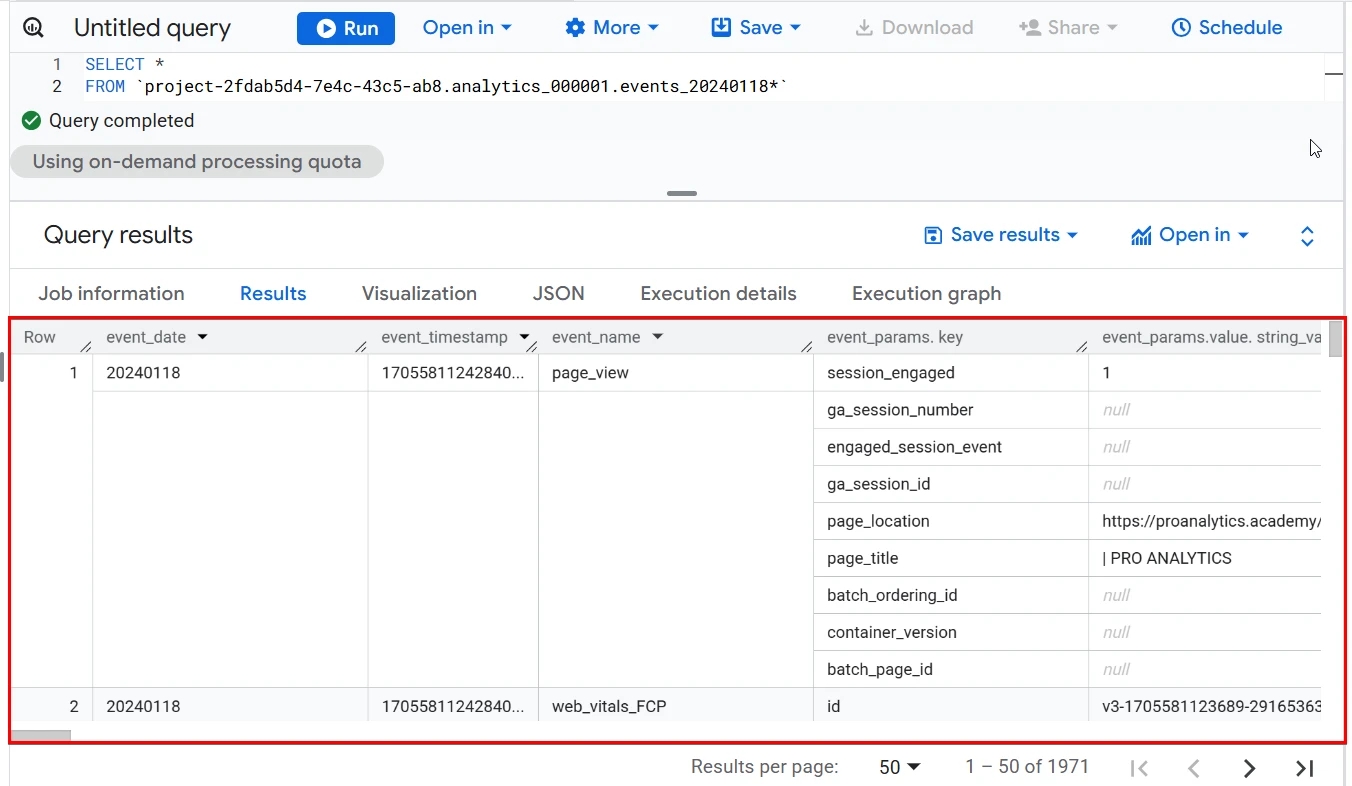
And sometimes you need to pull data only for a specific date range. And here is something very important: I often see people who are just starting out with BigQuery write something like:
SELECT
  event_name,
  traffic_source.source
FROM `project-2fdab5d4-7e4c-43c5-ab8.analytics_000001.events_*`
WHERE event_date BETWEEN '20240101' AND '20240131';
But even though this is correct from a SQL syntax standpoint, from a BigQuery billing standpoint it is one of the most common mistakes. In the case of the previous query, you will pay for all GA4 data you have in the dataset, even for the dates you don’t need.
To avoid unnecessary charges, use the special pseudocolumn _TABLE_SUFFIX. The query will look like this:
SELECT *
FROM `project-2fdab5d4-7e4c-43c5-ab8.analytics_000001.events_*`
WHERE _TABLE_SUFFIX BETWEEN '20240101' AND '20240131'
Both of the previous queries return data only for January 1–31, 2024. The only difference is that in the first case you will pay for all the data in the dataset, while in the second case you will pay only for January 1–31, 2024.
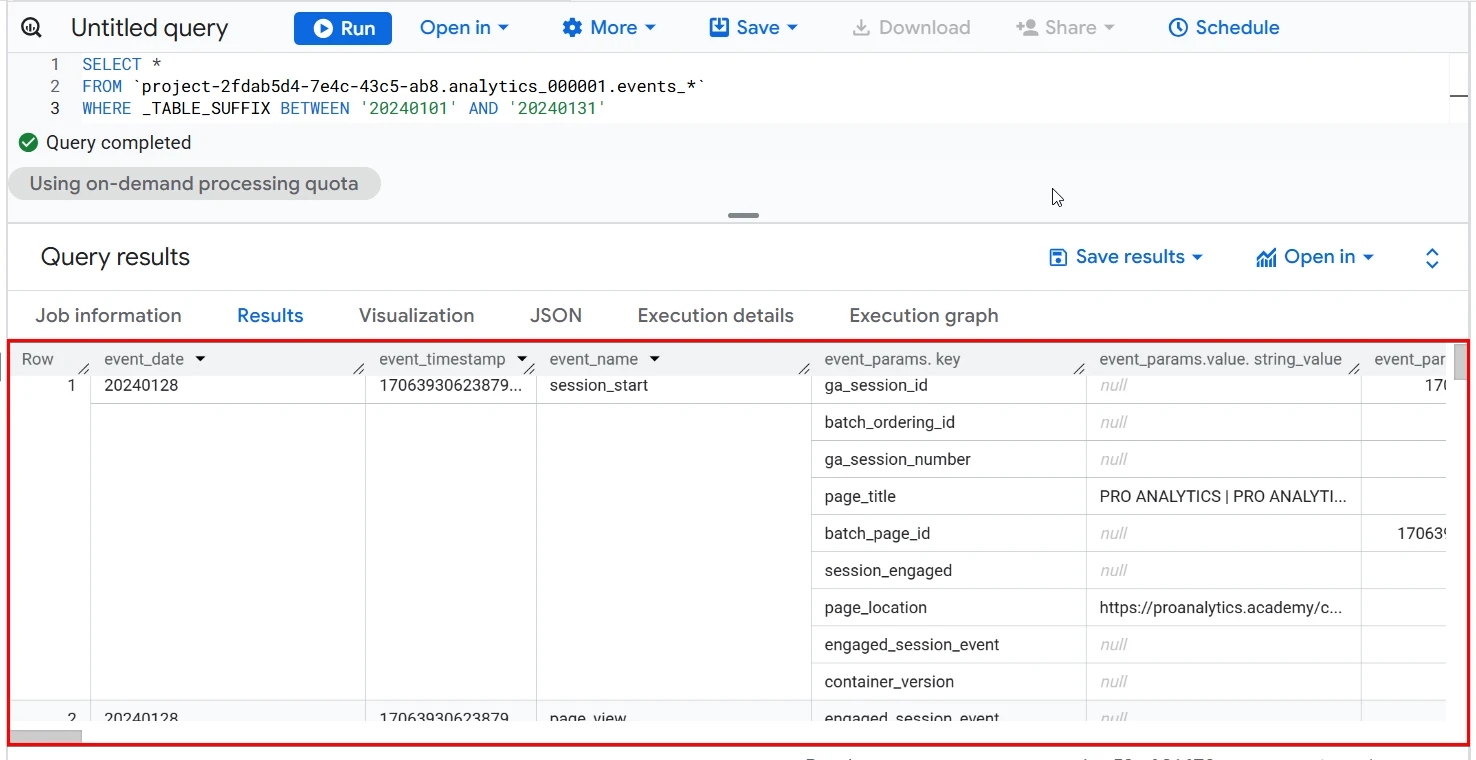
Note that the BETWEEN operator includes both end values in the range — meaning in our case both January 1 and January 31.
Why use _TABLE_SUFFIX instead of event_date?
Filtering via _TABLE_SUFFIX allows BigQuery to skip tables that do not fall within the range even before scanning them. This makes the query significantly faster and cheaper compared to filtering by the event_date field.
Now you can filter data and select only the columns you need from the table, but this is just the beginning: the most interesting part starts with calculating the core metrics. That is exactly what we will cover next.
Part 2: Calculating the Number of Users and Sessions Using GA4 Export Data in BigQuery
Working with GA4 data in BigQuery starts with understanding how to correctly count users. So we will start with that, and then go through the nuances of calculating other metrics.
And so that we are not just discussing calculations in a vacuum, at the end of the whole process we will apply what we’ve learned to build the Pages and Screens report.
2.1 COUNT Function Combined with DISTINCT: User Calculation
In the GA4 data model, the basic technical identifier is user_pseudo_id — an anonymous client ID automatically generated by GA4, which ties all events to a specific browser or device. It is present in every event row, so it is used to count unique users.
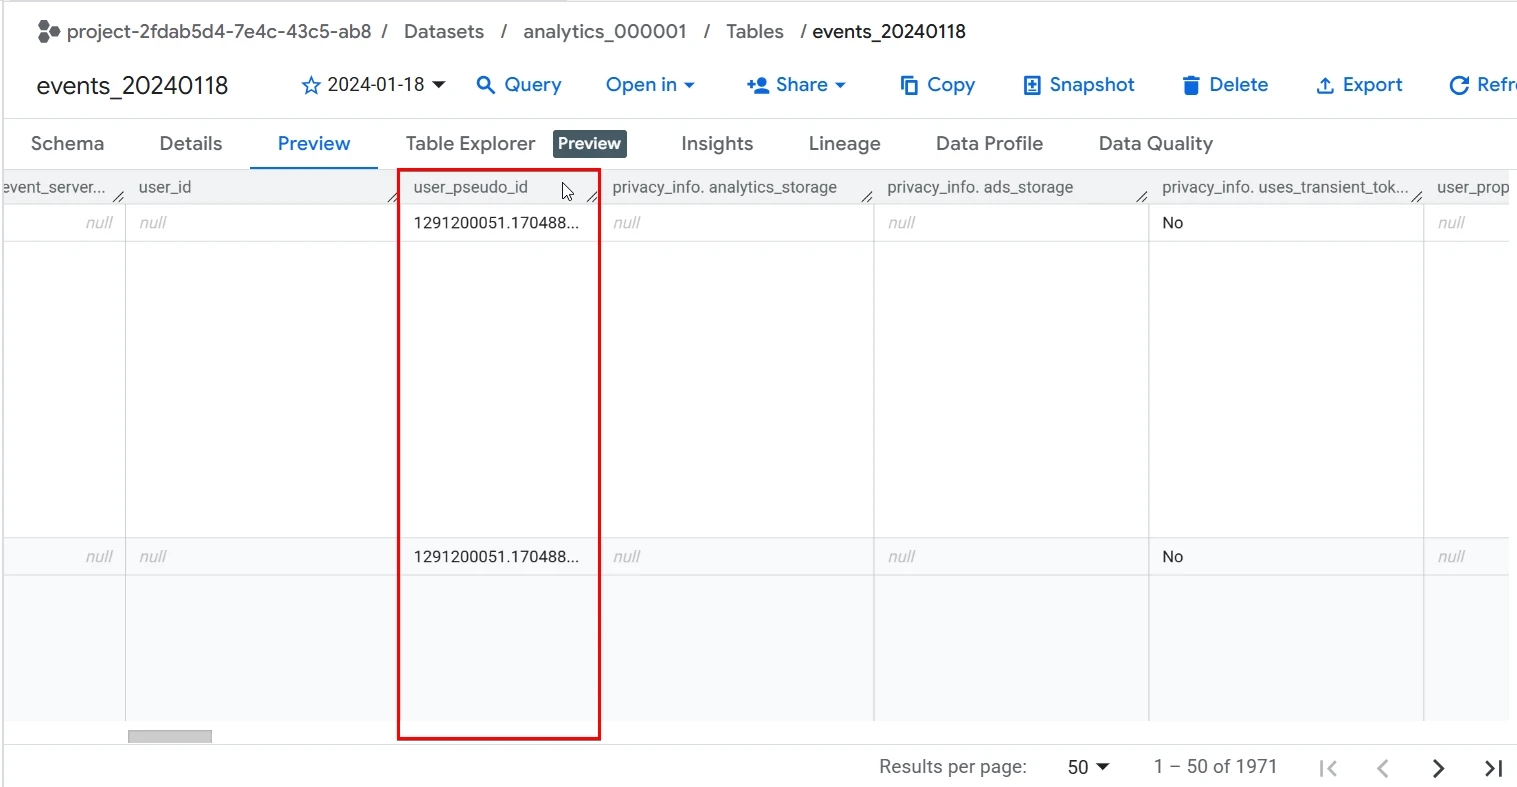
To count something in SQL, the COUNT function is used, which counts the number of records in a table. For example, this is how I can get the number of events in a table:
SELECT COUNT(event_name)
FROM `project-2fdab5d4-7e4c-43c5-ab8.analytics_000001.events_20240118`
But to count the number of users, we need to count only unique user_pseudo_id values, so in addition to COUNT we will use DISTINCT — in other words, the COUNT(DISTINCT ...) method. The query will look like this:
SELECT COUNT(DISTINCT user_pseudo_id)
FROM `project-2fdab5d4-7e4c-43c5-ab8.analytics_000001.events_20240118`
As we can see, during the selected period, 58 unique users visited our website.
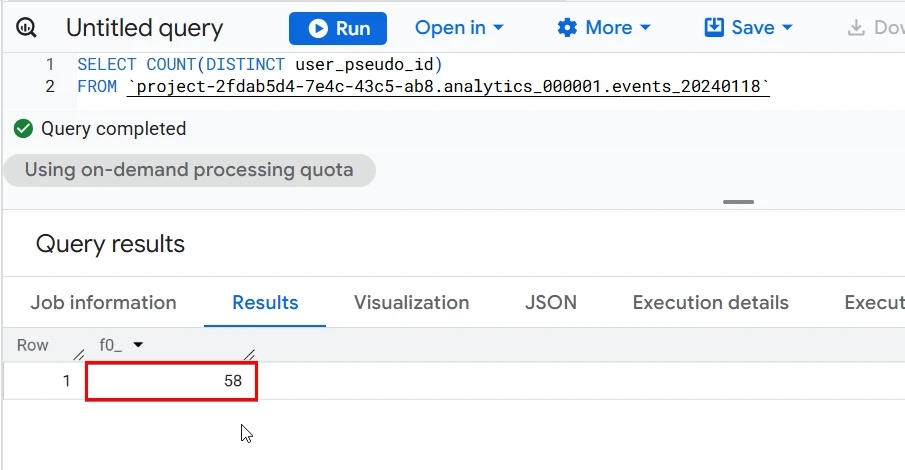
Note that the COUNT function does not count values that are NULL. This means that only rows where the field you specify contains an actual value are counted.
If we did not use DISTINCT, then we would get the number 1971:
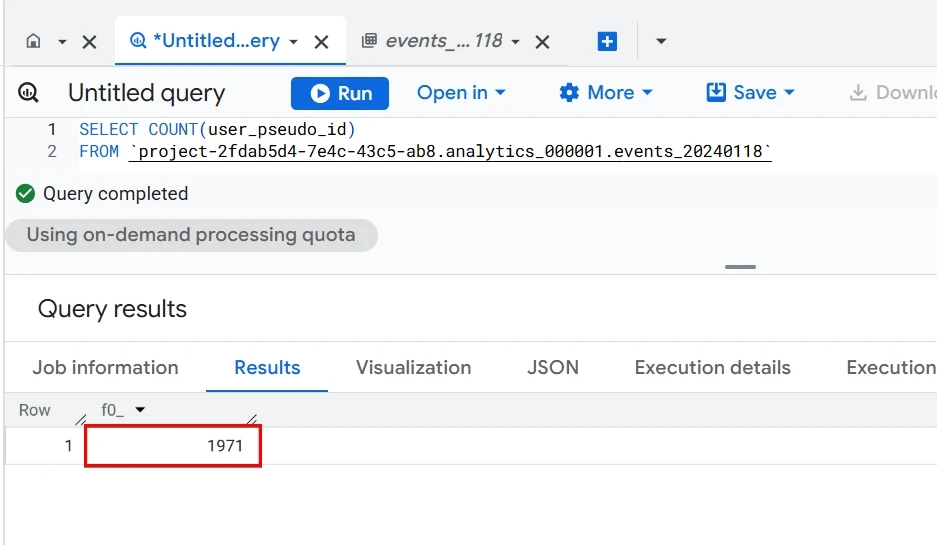
In other words, we would get only the total number of rows (events) that contain user_pseudo_id.
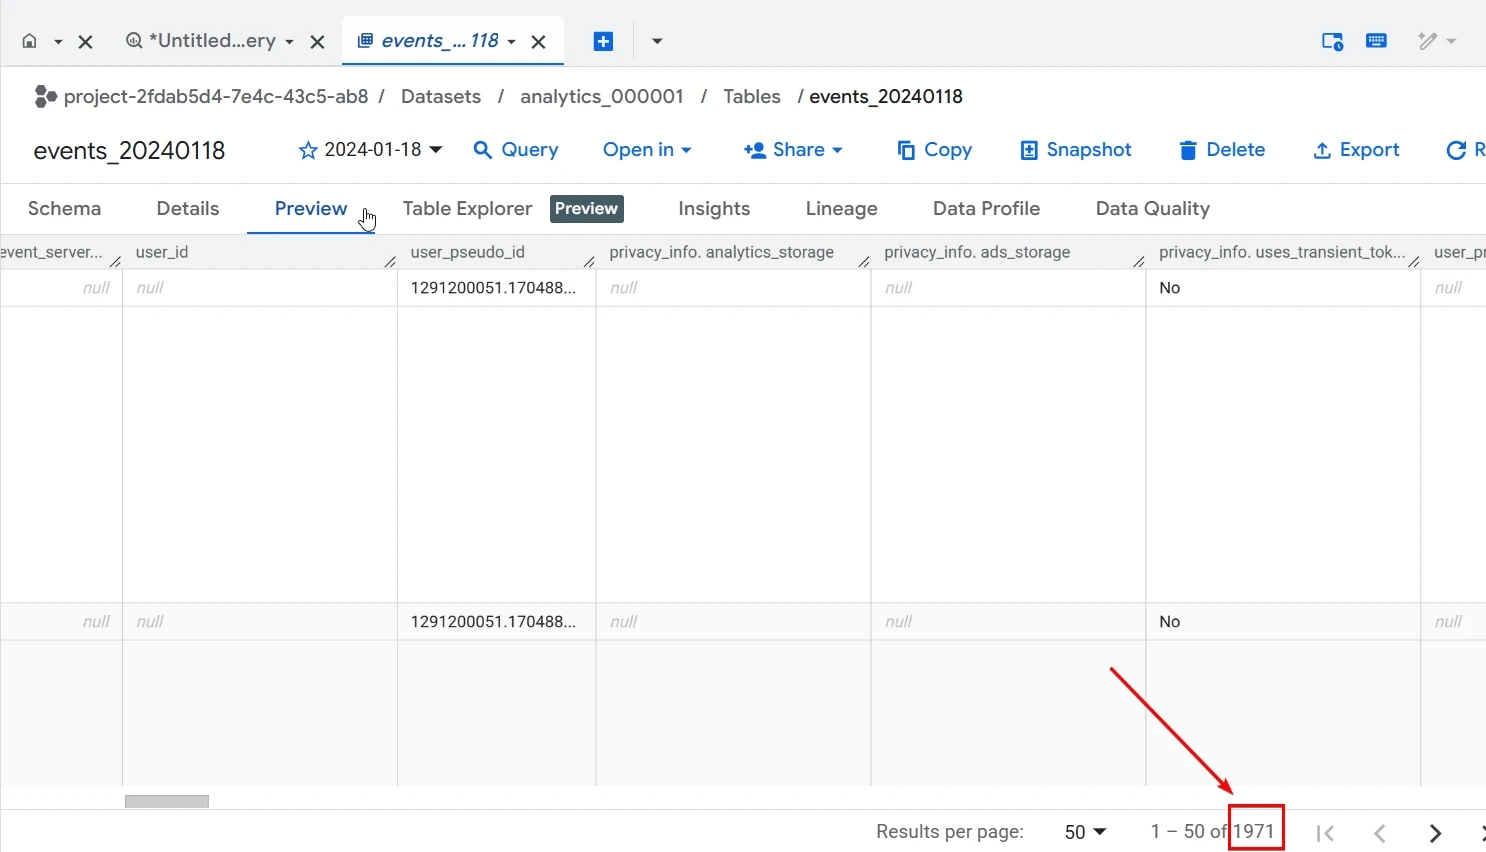
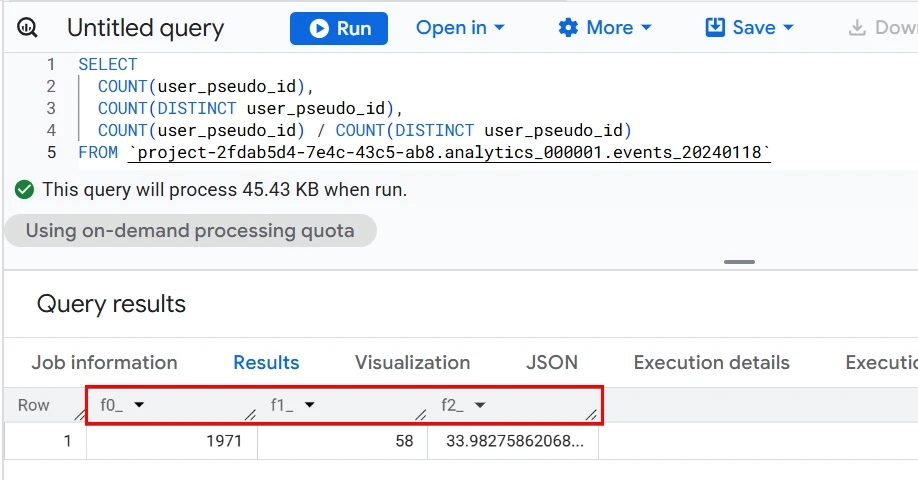
Based on these counts, you can build other metrics as well. For example, if you want to understand how many events one user performs on average, you can calculate everything in a single query:
SELECT
  COUNT(user_pseudo_id),
  COUNT(DISTINCT user_pseudo_id),
  COUNT(user_pseudo_id) / COUNT(DISTINCT user_pseudo_id)
FROM `project-2fdab5d4-7e4c-43c5-ab8.analytics_000001.events_20240118`
Pay attention to an important point: yes, we can do calculations directly in SELECT — for example, divide the number of events by the number of unique users. And that is exactly what makes SQL so powerful.
But take a look at the result: yes, our metrics were calculated, but the column names…
Using AS for column naming
To make the result columns easier to read, you can assign names to them. For this, the AS operator is used. Let’s specify names for our columns and look at the result again:
SELECT
  COUNT(user_pseudo_id) AS events,
  COUNT(DISTINCT user_pseudo_id) AS unique_users,
  COUNT(user_pseudo_id) / COUNT(DISTINCT user_pseudo_id) AS avg_events_per_user
FROM `project-2fdab5d4-7e4c-43c5-ab8.analytics_000001.events_20240118`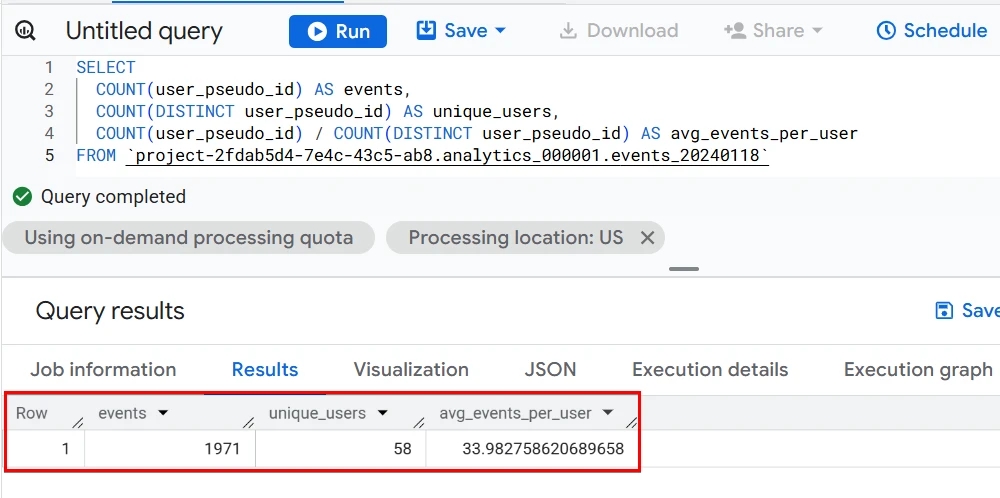
Much better.
Functions for mathematical calculations
In addition to counting users and events, SQL can be used to perform other mathematical calculations. This makes it possible to create additional metrics directly in queries and analyze user behavior across different breakdowns. We have already looked at COUNT, which counts the number of events in a table, but there are others as well:
- SUM — returns the sum of all numeric elements in a column. Useful, for example, for calculating revenue for a period.
SELECT
  SUM(ecommerce.purchase_revenue) AS purchase_revenue
FROM `project-2fdab5d4-7e4c-43c5-ab8.analytics_000001.events_20240118`
WHERE event_name = "purchase"- AVG — calculates the average value of a numeric column. The function works only with numeric data types. This can be useful, for example, when calculating the average order value.
SELECT AVG(ecommerce.purchase_revenue) AS avg_check
FROM `project-2fdab5d4-7e4c-43c5-ab8.analytics_000001.events_20240118`
WHERE event_name = "purchase"- MIN/MAX — returns the smallest/largest value in the selected field. For example, we can determine the first and last event of the day:
SELECT
  MIN(event_timestamp) AS first_event_received,
  MAX(event_timestamp) AS last_event_received
FROM `project-2fdab5d4-7e4c-43c5-ab8.analytics_000001.events_20240118`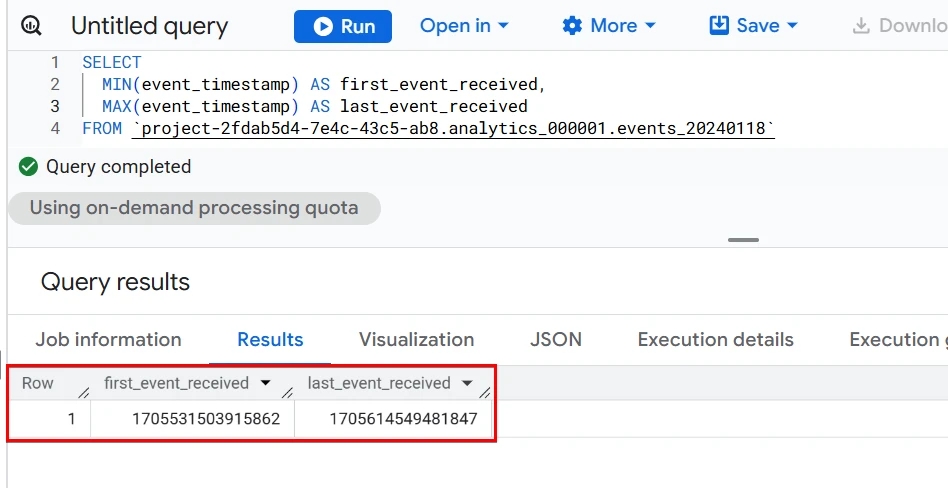
To convert the values into a more readable datetime format, you can use TIMESTAMP_MICROS():
SELECT
  TIMESTAMP_MICROS(MIN(event_timestamp)) AS first_event_received,
  TIMESTAMP_MICROS(MAX(event_timestamp)) AS last_event_received
FROM  `project-2fdab5d4-7e4c-43c5-ab8.analytics_000001.events_20240118`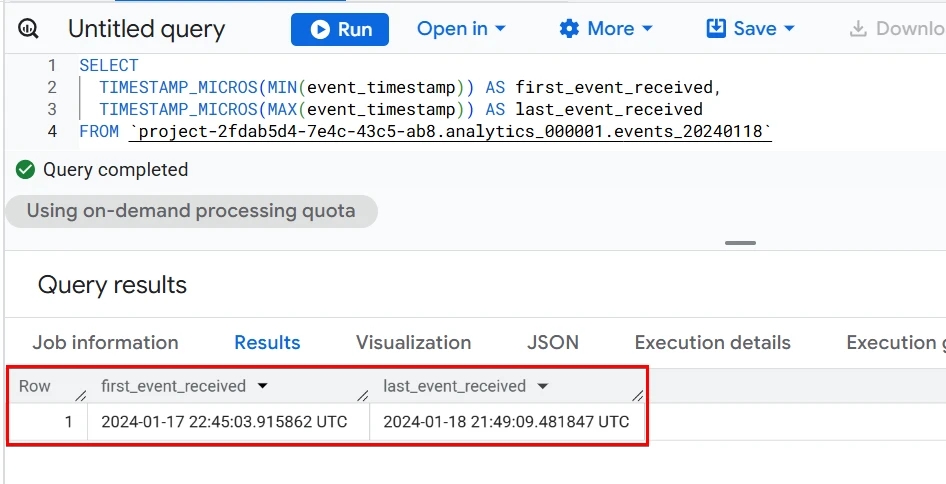
Of course, there are many more such functions, but I think you get the idea. More details here.
2.2 CONCAT Operator: how to get a Session ID and calculate the number of sessions using GA4 export data in BigQuery
Another common mistake I see among those who are just starting out with BigQuery is counting sessions incorrectly. In export data, there is a value called ga_session_id, and beginners often treat it as a unique session ID. But that is a mistake. ga_session_id is a timestamp — the session start time rounded to the nearest second.
Через це можливий наступний сценарій:
Because of this, the following scenario is possible:
- two different users can start a session in the exact same second,
- as a result, both will get the same ga_session_id,
- so a simple COUNT(DISTINCT ga_session_id) will return an underestimated number of sessions, because sessions from different visitors with the same session start timestamp will be counted as one session.
To get the correct number of sessions, you need to form a unique key that combines both the user identifier and the session start time. But before we do that, we need to go through one more important point.
2.3 Nested Fields and the role of UNNEST when working with GA4 data
One of the key differences between GA4 export data in BigQuery and many other tabular datasets is that event data is not stored as a flat table with dozens of separate columns. Instead, GA4 uses a nested data structure.
The most illustrative example is the event_params field. At first glance, it is one column, but inside it contains an array of RECORD objects, where each element is a pair:
- key — the event parameter name (for example,
page_location,page_title,ga_session_id) - value — an object with multiple fields:
string_value,int_value,float_value,double_value.
So instead of dozens of separate columns, GA4 “packs” parameters into a nested structure, which makes the table flexible on the one hand, and more complex to read on the other.
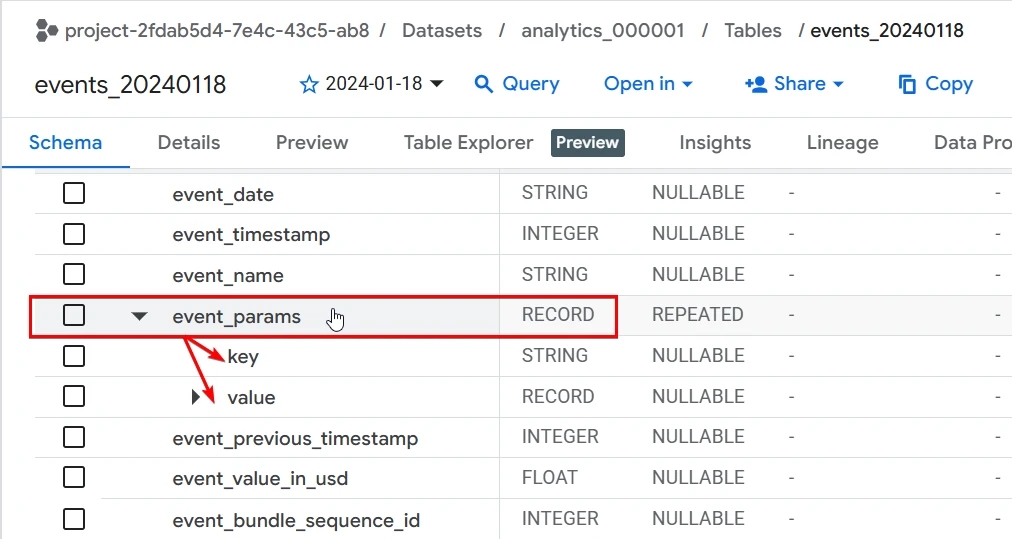
To work with this data, we cannot simply write SELECT event_params.page_location, because such a column does not exist: the parameter value is inside an array, and you need to access it by key. We need to “unpack” this array. That is what the UNNEST function is used for:
SELECT
  event_date,
  event_name,
  user_pseudo_id,
  param.key,
  param.value.string_value,
  param.value.int_value,
  param.value.float_value
FROM `project-2fdab5d4-7e4c-43c5-ab8.analytics_000001.events_20240118`,
  UNNEST(event_params) AS param;
As a result, each element of the event_params array becomes a separate row for each event.
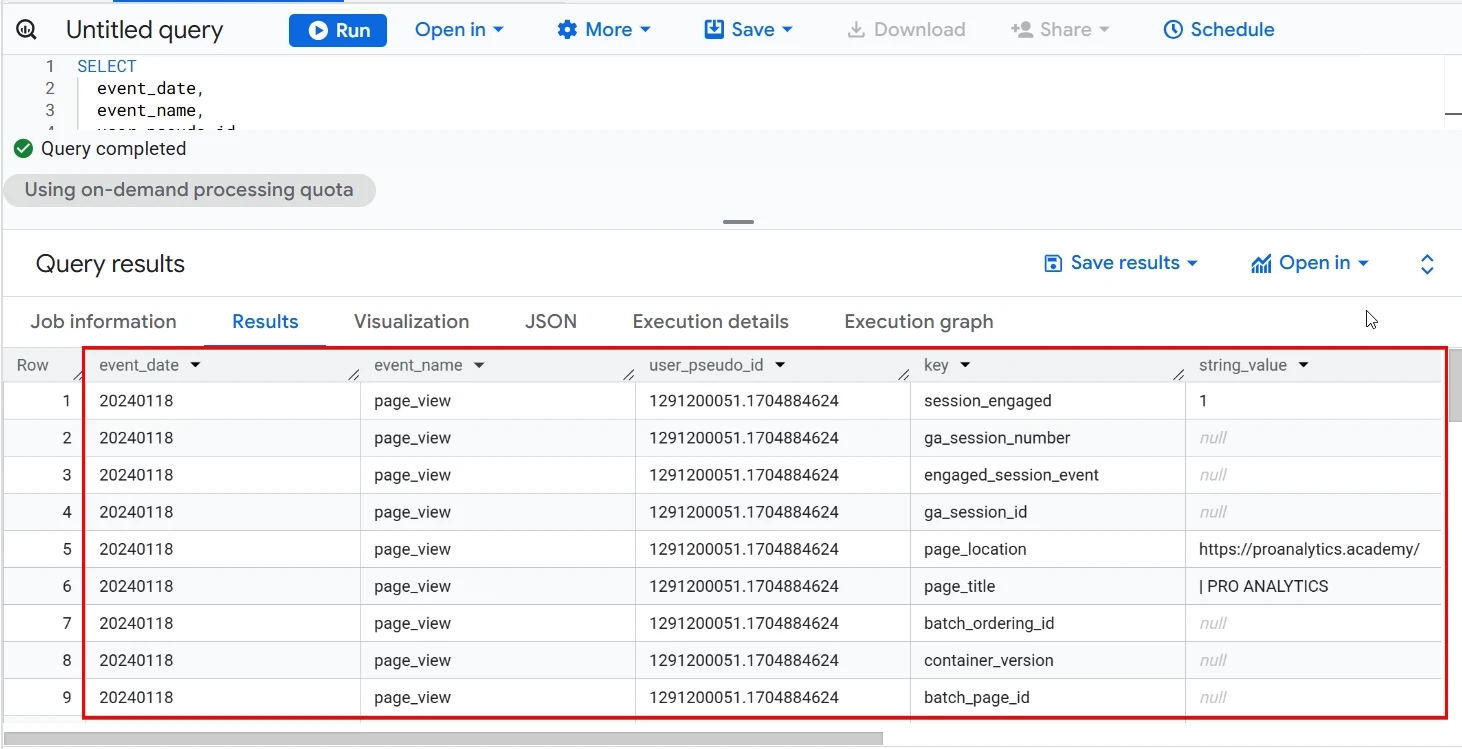
So, UNNEST is used to expand (unpack) arrays and nested structures within table rows in BigQuery.
Scalar subqueries — a practical way to work with GA4 parameters
Now that we understand what UNNEST does, let’s try to retrieve the value of a specific parameter for each event. To return a parameter value without duplicating rows, BigQuery uses so-called scalar subqueries. This is a small query inside SELECT that:
- runs UNNEST only for one specific row;
- finds the required parameter by key;
- returns only one value;
- adds it as a new column.
For example, let’s extract the value of the ga_session_id parameter from the event_params array and return it as a regular column:
SELECT
  event_date,
  event_name,
  (SELECT value.int_value
   FROM UNNEST(event_params)
   WHERE key = 'ga_session_id') AS ga_session_id
FROM `project-2fdab5d4-7e4c-43c5-ab8.analytics_000001.events_20240118`;
In this query, you might wonder what value.int_value means. In the event_params array, each parameter has the structure key -> value, where value is a RECORD field with several possible value types:
- string_value — if the parameter is textual;
- int_value — if the value is an integer;
- double_value або float_value — if it is a decimal number.
So value.int_value means: “take the integer value of the parameter”.
As a result, we get an additional column with the ga_session_id value:
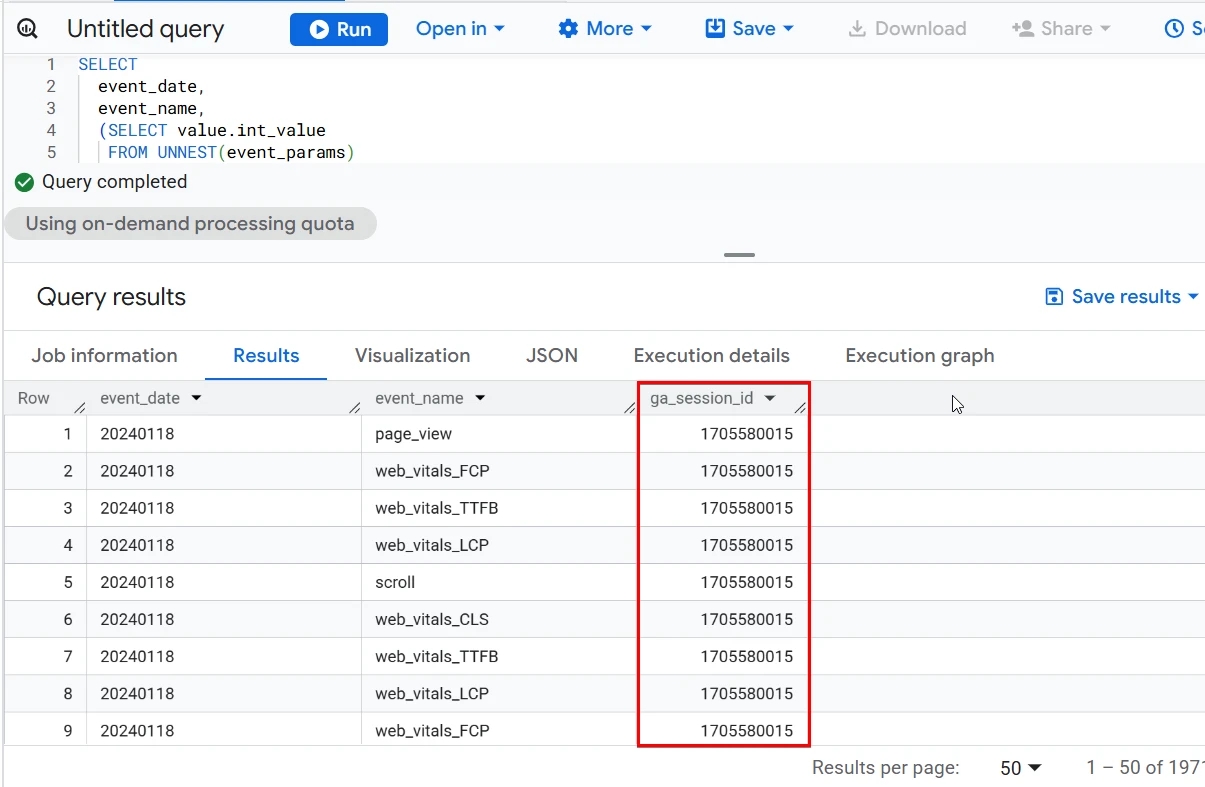
This technique is standard when working with GA4 data in BigQuery in cases where you need to extract nested values from a fairly large list, including but not limited to: page_location, page_title, ga_session_id, and all custom event parameters.
So now that we can get the ga_session_id value, let’s create a real session ID and count the number of sessions.
For this, we will use the CONCAT operator, which combines multiple values into a string. Let’s build this unique real_session_id:
SELECT
  user_pseudo_id,
  (SELECT value.int_value
   FROM UNNEST(event_params)
   WHERE key = 'ga_session_id') AS session_start_time,
  CONCAT(
    user_pseudo_id,
    '-',
    (SELECT value.int_value
     FROM UNNEST(event_params)
     WHERE key = 'ga_session_id')
  ) AS real_session_id
FROM
  `project-2fdab5d4-7e4c-43c5-ab8.analytics_000001.events_20240118`;
In this format, each session of each user receives its own unique identifier, which allows you to accurately build the sessions metric in BigQuery.
Important: if at least one argument in CONCAT is NULL, the result will also be NULL. In our case, it does not matter. But in general, it is important to know this — otherwise, in more complex calculations you may get a result you did not expect.
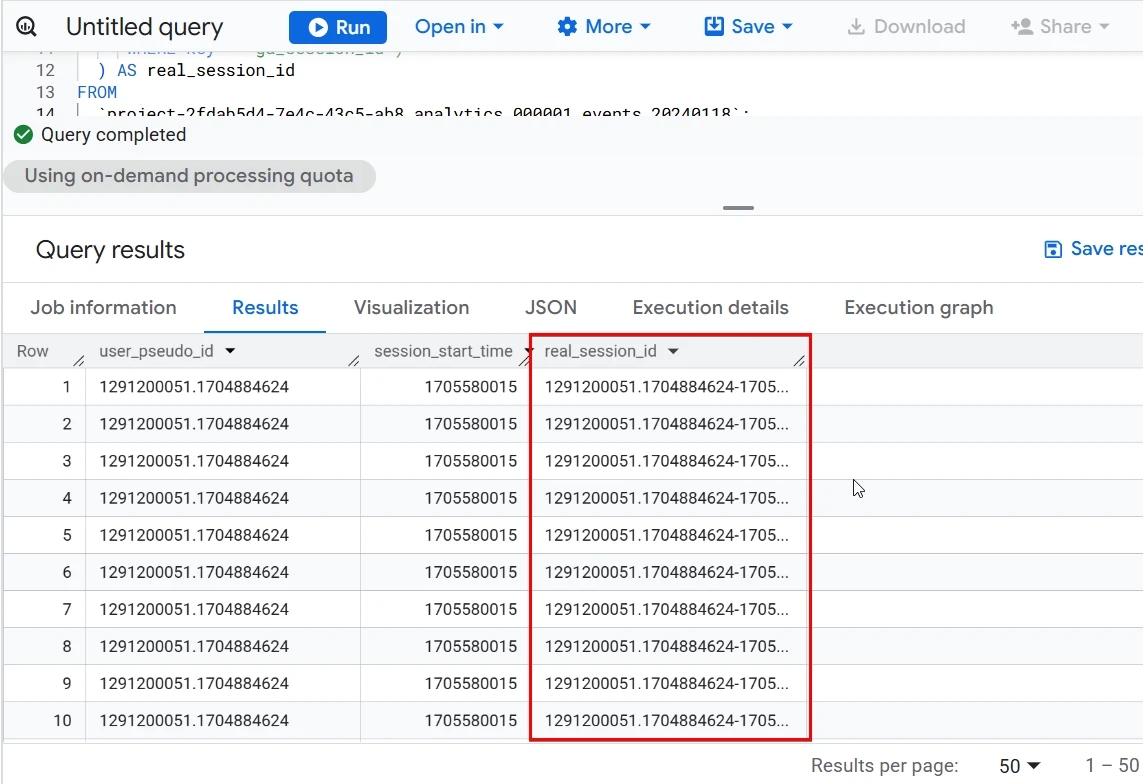
To count the number of sessions, you can use the following SQL query:
SELECT
  COUNT(DISTINCT
    CONCAT(
    user_pseudo_id,
    '-',
    (SELECT value.int_value
     FROM UNNEST(event_params)
     WHERE key = 'ga_session_id')
    )
  ) AS sessions
FROM `project-2fdab5d4-7e4c-43c5-ab8.analytics_000001.events_20240118`;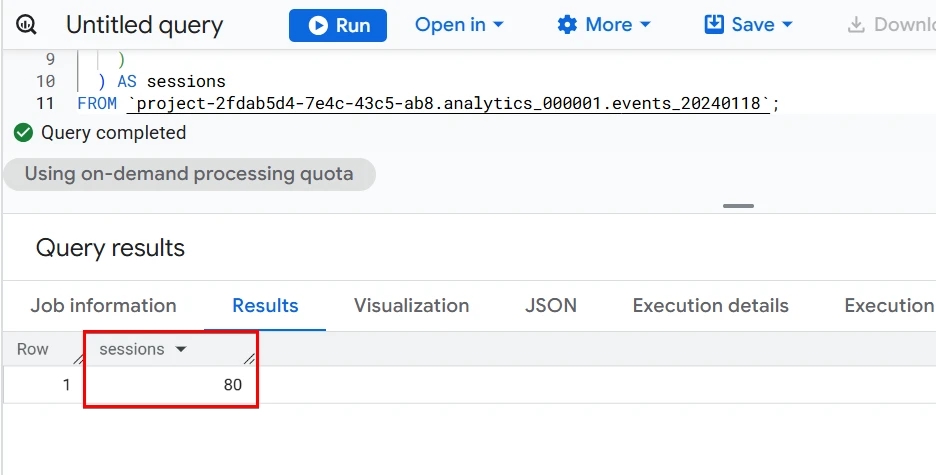
CONCAT alternative: the || operator
In BigQuery, you can also concatenate using this syntax:
user_pseudo_id || '-' || ga_session_id2.4 GROUP BY — breaking calculations down by required parameters
After we learned how to calculate the number of events, the number of unique users, and the number of sessions, there is a need to view these values across a specific breakdown. For this, the GROUP BY operator is used.
GROUP BY groups table rows by the values of certain fields and allows you to apply aggregate functions (COUNT, SUM, AVG, etc.) separately for each group.
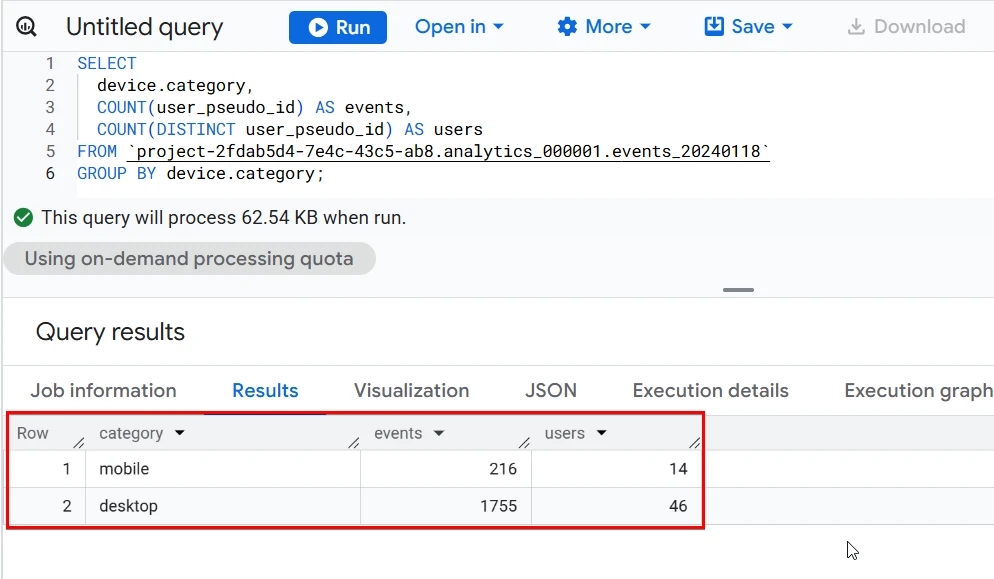
For example, let’s calculate:
- how many events users performed on different device categories,
- and how many unique users there were on each of them.
SELECT
  device.category,
  COUNT(user_pseudo_id) AS events,
  COUNT(DISTINCT user_pseudo_id) AS users
FROM `project-2fdab5d4-7e4c-43c5-ab8.analytics_000001.events_20240118`
GROUP BY device.category;
And we will get a table where each row is a separate device category (desktop/mobile), and next to it — the number of events and users.
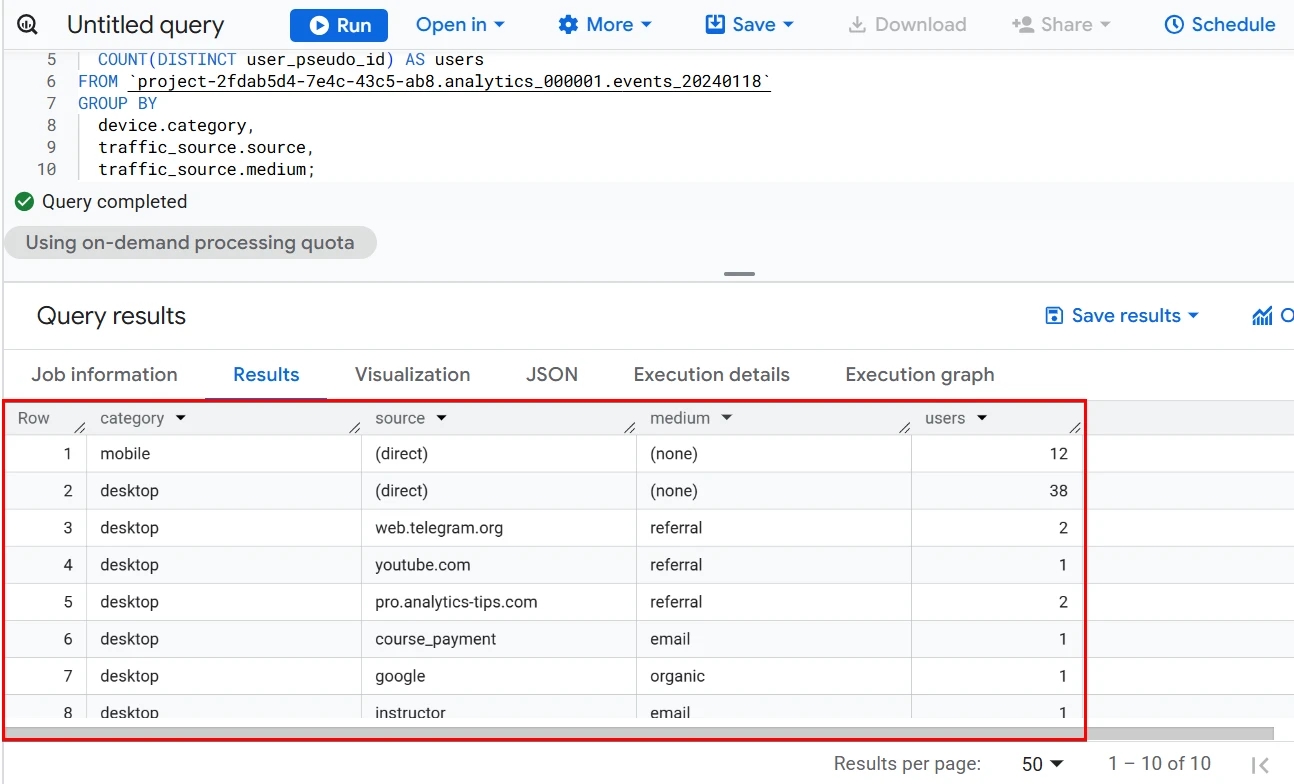
We can also group by multiple parameters. For example, let’s look at metrics by device and traffic source (through which the user first visited the site):
SELECT
  device.category,
  traffic_source.source,
  traffic_source.medium,
  COUNT(DISTINCT user_pseudo_id) AS users
FROM `project-2fdab5d4-7e4c-43c5-ab8.analytics_000001.events_20240118`
GROUP BY
  device.category,
  traffic_source.source,
  traffic_source.medium;
And we will get a table like this:
2.5 ORDER BY — how to sort results
After the metrics are calculated, the results usually need to be organized. We can do this using the ORDER BY operator, which allows you to sort values in a table. For example, you can sort in descending/ascending order (DESC/ASC). Let’s sort our previous query in descending order by the number of users:
SELECT
  device.category,
  traffic_source.source,
  traffic_source.medium,
  COUNT(DISTINCT user_pseudo_id) AS users
FROM `project-2fdab5d4-7e4c-43c5-ab8.analytics_000001.events_20240118`
GROUP BY
  device.category,
  traffic_source.source,
  traffic_source.medium
ORDER BY users DESC;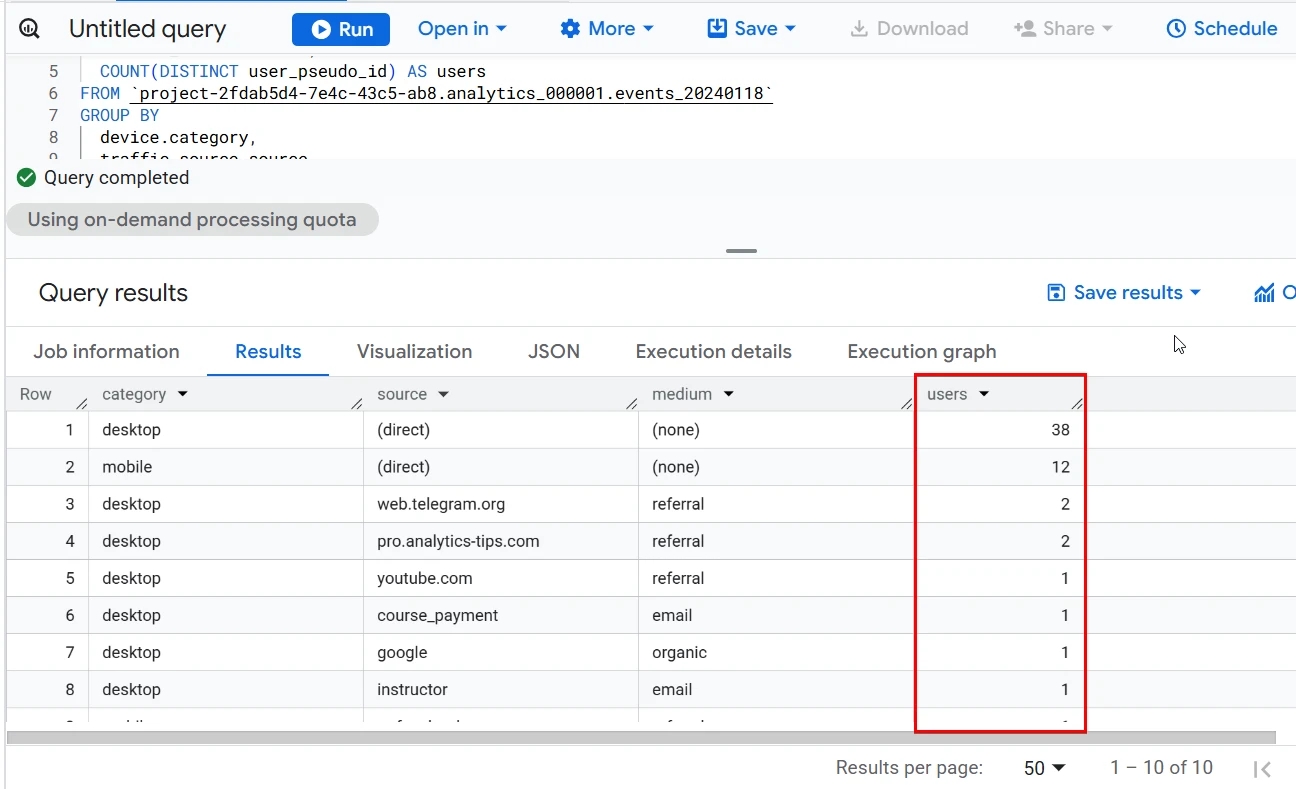
Text values will be sorted alphabetically.
Part 3: Building the “Pages and Screens”
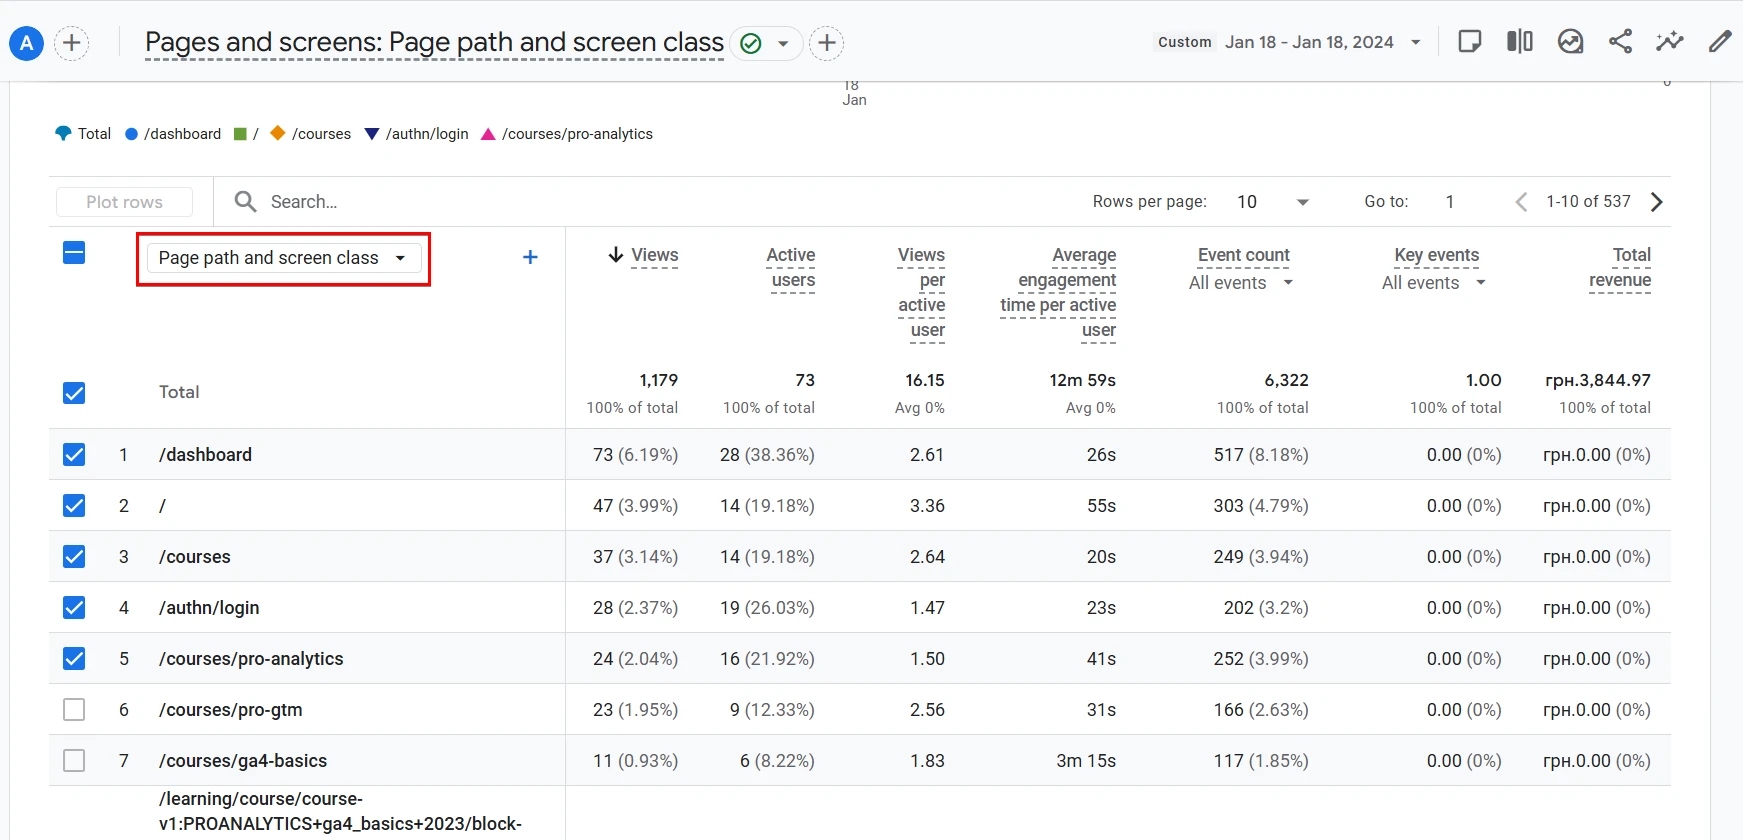
Now let’s combine everything we have learned and build your first GA4 interface report using raw data. I chose one of the easiest reports to understand — Pages and Screens. It shows which content gets the most attention, how users interact with pages, and how many events happen there.
In this part of the article, we will fully recreate this report in SQL, step by step — so that it works without sampling, without interface limitations, and with full control over the calculation logic.
3.0 Pages and Screens report structure: which parameters and metrics we need to replicate
Before moving to SQL, you need to clearly understand which data is included in the GA4 report. Google officially describes the report structure in its help documentation.
Parameters in the Pages and Screens report:
- Content group.
- Hostname — domain.
- Page path and screen class — page path (including the query string) or screen class.
- Page title and screen class.
- Page title and screen name.
For this article, we will focus on the most popular parameter — Page Path, because it is usually where analysis starts, and it is the foundation of the report in the interface.
Metrics in the report:
- Views — page views. .
- Active users — users who, by GA4 team definitions, were active in the analysis period. I believe that activity should be calculated differently for each project, so we will calculate Total Users instead of Active Users, but we’ll get to that in order.
- Views per active user — the average number of views per active user, which in our case is simply per user.
- Average engagement time per active user — the average time spent engaging with the page per user.
- Event count — number of events.
- Key Events — number of key events (conversions).
- Total revenue— revenue generated on the page.
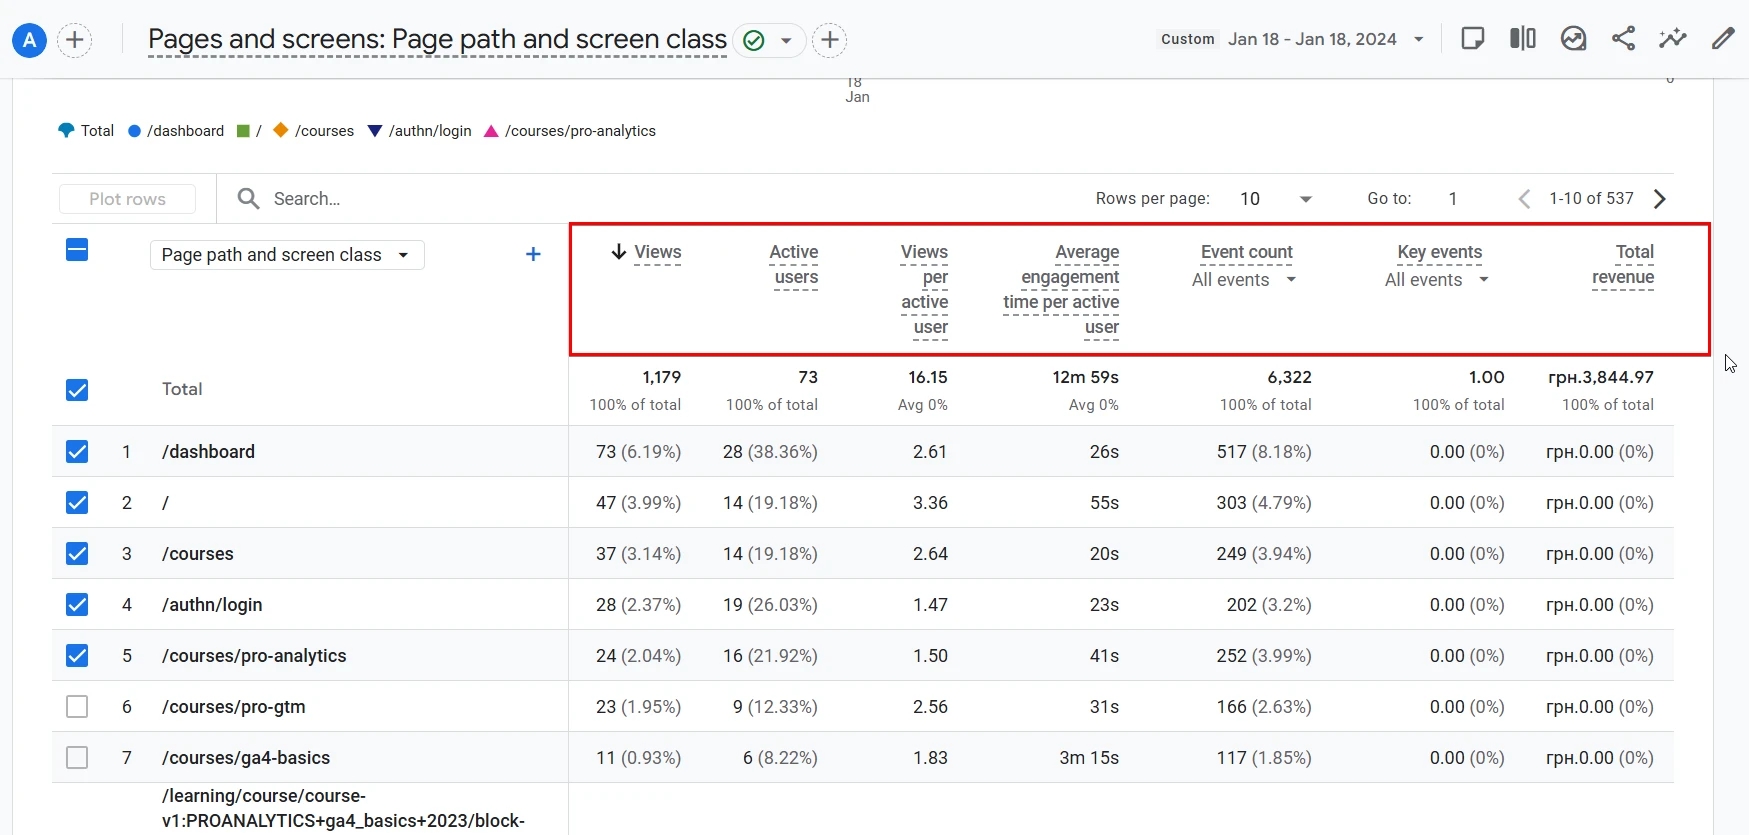
We will recreate all of these metrics in BigQuery.
3.1 Selecting the page_location parameter
In the Pages and Screens report, the first column is the Page path and screen class parameter. It defines the breakdown in which all other metrics are shown (Views, Users, Event count, etc.).
In raw GA4 data in BigQuery, the page path is stored in the page_location parameter inside the event_params array. This field contains the full page URL (including the domain and query parameters). At the first step, page_location works for us — we will simply learn how to extract it.
Let’s get page_location using UNNEST. We start with a simple query that:
- takes the GA4 events table,
- unpacks the event_params array with UNNEST,
- extracts only the value with the page_location key,
- adds it into a separate page_location column.
SELECT
  -- Extract the page URL from event_params
  (SELECT value.string_value
   FROM UNNEST(event_params)
   WHERE key = 'page_location') AS page_location,
  -- Output all other standard event columns
  *
FROM `project_name.dataset_name.events_YYYYMMDD`;
Since this is a scalar subquery in SELECT, we get one page_location value per row in the events table. Then * adds all the other standard columns (event_name, event_timestamp, user_pseudo_id, etc.) so it is convenient to validate against the data.
As a result, we get the first column of the future Pages and Screens report: the page URL, which we will later use to group all metrics.
3.2 Metric calculation
With the base page_location parameter, we can move on to building the metrics from the standard Pages and Screens report.
3.2.1 Views metric
A view is the page_view event. To count the number of views, the most convenient option is to use the COUNTIF function, which counts only the rows that match a specific condition.
COUNTIF(event_name = 'page_view') AS viewsKeep in mind that on the web this is the page_view event, but if you need this for mobile apps, use screen_view.
3.2.2 Total Users metric
Here you already know the approach: we use COUNT(DISTINCT ...) on the user_pseudo_id column — the unique browser/device identifier in GA4. Since we are grouping by page, this will show the number of unique users who visited a specific page.
COUNT(DISTINCT user_pseudo_id) AS usersThis is the number of all users who interacted with the page.
In standard GA4 reports, “Users” means Active users, but in BigQuery we get Total users — meaning all users without the activity filter. This is a normal and expected difference.
3.2.3 Views per user metric
After we get the base metrics — views and users — we can move on to derived metrics. One of the key ones is Views per user, i.e., the average number of views made by one user on a specific page.
In GA4, this metric reflects how much users “return” to the page and how often they interact with it. In BigQuery, it can easily be recreated as a simple division of one metric by another.
The formula consists of two parts we have already calculated:
- numerator: the number of
page_viewevents - denominator: the number of unique users (
user_pseudo_id)
The final formula looks like this:
COUNTIF(event_name = "page_view") / COUNT(DISTINCT user_pseudo_id) AS views_per_userSo we simply divide the number of views by the number of people who generated those views.
3.2.4 Average engagement time per user metric
Average engagement time is one of the key behavioral metrics in GA4. It reflects not just time spent on a page, but the period when a user is actually interacting with the page or when the page is in the browser’s focus.
In BigQuery, this metric does not exist as a ready-made field — it needs to be recreated manually using the engagement_time_msec parameter. This value is sent in each event that is triggered during active user engagement with the site.
How GA4 builds engagement_time_msec
In GA4, engagement is a continuous process. While the page is active, the browser regularly sends events (scroll, user_engagement, etc.) with the accumulated time.
For example, it may look like this:
| Подія | engagement_time_msec | What it means |
|---|---|---|
scroll | 8781 | The user scrolled the page for ~8.7 sec |
user_engagement | 11856 | The user moved to the next page. The system sent another 11.8 sec of engagement time |
These values are parts of the same cumulative time. To get the full number, you need to add all these pieces together.
So, let’s build Average engagement time per user in SQL:
- Extract
engagement_time_msecfrom event_params
This is a separate parameter in the event_params array. For each row in the table, we run a scalar subquery:
(SELECT value.int_value
 FROM UNNEST(event_params)
 WHERE key = "engagement_time_msec")
This subquery returns:
- either a number (ms),
- or NULL (if the event does not include engagement time).
2. Sum all values for a specific page
Each row contains a part of engagement, so all values need to be added:
SUM(
  (SELECT value.int_value
   FROM UNNEST(event_params)
   WHERE key = "engagement_time_msec")
)
This gives the total engagement time across all events on the page.
3. Divide by the number of users
SUM(...) / COUNT(DISTINCT user_pseudo_id)4. Convert milliseconds to minutes
- 1000 — milliseconds per second
- 60 — seconds per minute
/ 1000 / 605. Combine everything into the final metric formula:
SUM(
  (SELECT value.int_value
   FROM UNNEST(event_params)
   WHERE key="engagement_time_msec")
) / COUNT(DISTINCT user_pseudo_id) / 1000 / 60 AS avg_engagement_time
3.2.5 Event count metric
This metric shows how many events occurred on the page. For example, in my test data there is an event named click_button.
COUNTIF(event_name = "click_button") AS event_countIt is important to keep the event name exactly as it appears in GA4 data.
In the same way, you can add other events to the report — for example: scroll, file_download, sign_up, etc.
3.2.6 Key Events metric (Key Events)
In GA4, key events are those marked as Key events. In SQL, we can count any events. For example, let’s use the purchase event.
COUNTIF(event_name = "purchase") AS conversions3.2.7 Total revenue metric
In BigQuery, purchase revenue is available via the ecommerce.purchase_revenue field.
SUM(ecommerce.purchase_revenue) AS total_revenueNote:
- if the site does not use eCommerce, the value will be 0;
- if there are no transactions on the page, the value will be 0.
3.3 Final Combined Query
At this point, we already have everything we need:
- the parameter we use for the breakdown — page_location;
- the set of metrics: views, users, views_per_user, avg_engagement_time, event_count, conversions, total_revenue.
All that’s left is to combine them into one query, group by page, and sort.
SELECT
  -- Parameter: page path (Page path)
  (SELECT value.string_value
   FROM UNNEST(event_params)
   WHERE key = "page_location") AS page_location,
  -- Metric: views
  COUNTIF(event_name = "page_view") AS views,
  -- Metric: users
  COUNT(DISTINCT user_pseudo_id) AS users,
  -- Metric: views per user
  COUNTIF(event_name = "page_view") / COUNT(DISTINCT user_pseudo_id) AS views_per_user,
  -- Metric: average engagement time (minutes)
  SUM(
    (SELECT value.int_value
     FROM UNNEST(event_params)
     WHERE key = "engagement_time_msec")
  ) / COUNT(DISTINCT user_pseudo_id) / 1000 / 60 AS avg_engagement_time,
  -- Metric: event count
  COUNTIF(event_name = "click_button") AS event_count,
  -- Metric: conversions (key events)
  COUNTIF(event_name = "purchase") AS conversions,
  -- Metric: revenue
  SUM(ecommerce.purchase_revenue) AS total_revenue
FROM `project_name.dataset_name.events_YYYYMMDD`
GROUP BY
  page_location
ORDER BY
  views DESC;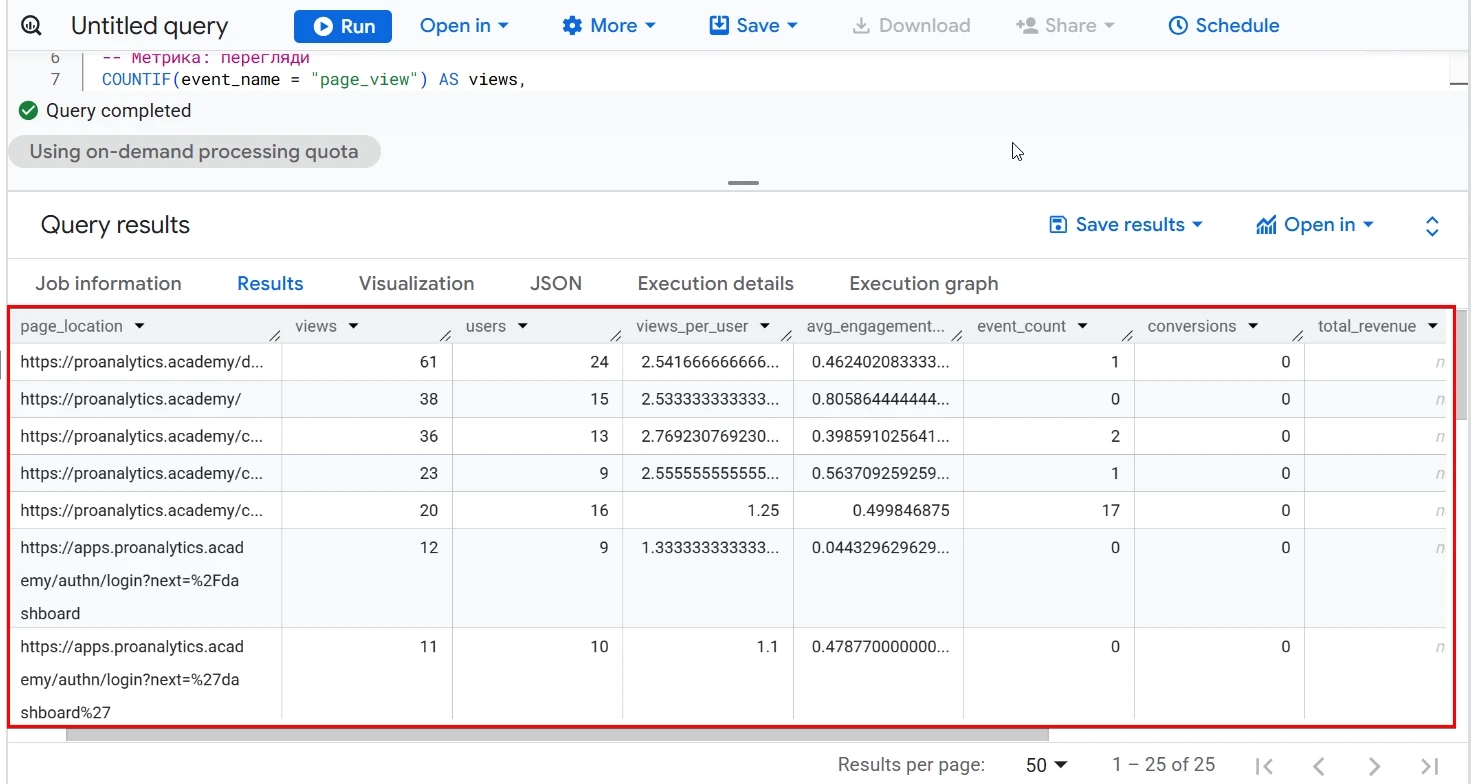
Congratulations — you have just built your first report using raw GA4 data.
Conclusion
Working with GA4 exports in BigQuery opens up a completely different level of possibilities for analysts. What is presented in the interface as ready-made metrics and aggregated reports becomes raw data in BigQuery — and SQL becomes the tool that allows you to assemble these events into a meaningful analytical picture.
The main points that define working with GA4 data in BigQuery can be formulated as follows:
- The table structure defines the logic of analysis.
GA4 exports events as nested structures and arrays. Without understanding the data model, it is difficult to correctly extract even a basic parameter. The ability to work with event_params via UNNEST and scalar subqueries is the foundation. - User and session identification are not “obvious” operations.
user_pseudo_id allows you to quickly count unique users using a device-based logic, while ga_session_id requires additional handling to avoid duplicates across different users. - SQL makes it possible to recreate GA4 reports without limitations.
We built all key Pages and Screens metrics manually — from Views and Total users to Average engagement time per user and Total revenue. Each formula is transparent: the analyst can see which events and parameters it consists of and can adapt the logic to specific business needs. - BigQuery is not just a “repeat” of GA4, but a chance to go further.
In SQL there is no sampling, no hidden calculations, no interface limitations. You control every part of the metric and can build analytics exactly the way your business needs. - BigQuery is much more than just working with raw data.
Yes, this last point was not covered much in the article, so I recommend reading another article on this topic — Everything you need to know about BigQuery: what it is, why you need it, and what the benefits are for marketing.
Loading comments…