
Everyone is used to the fact that Google Analytics can track page views, but the fact that a person viewed a page does not give any idea about how he interacted with it. I think that is why the team that developed Google Analytics 4 did not limit itself to just page views, but added the "Enhanced Measurements" functionality. As you can see from the screenshot below, with the help of this function, you can track such interactions of users with the site as:
- Page scrolling
- Clicks on external links
- Internal search on the site (actually, this item was also in the previous version of Google Analytics)
- Interaction with forms
- Interaction with video
- Downloading files
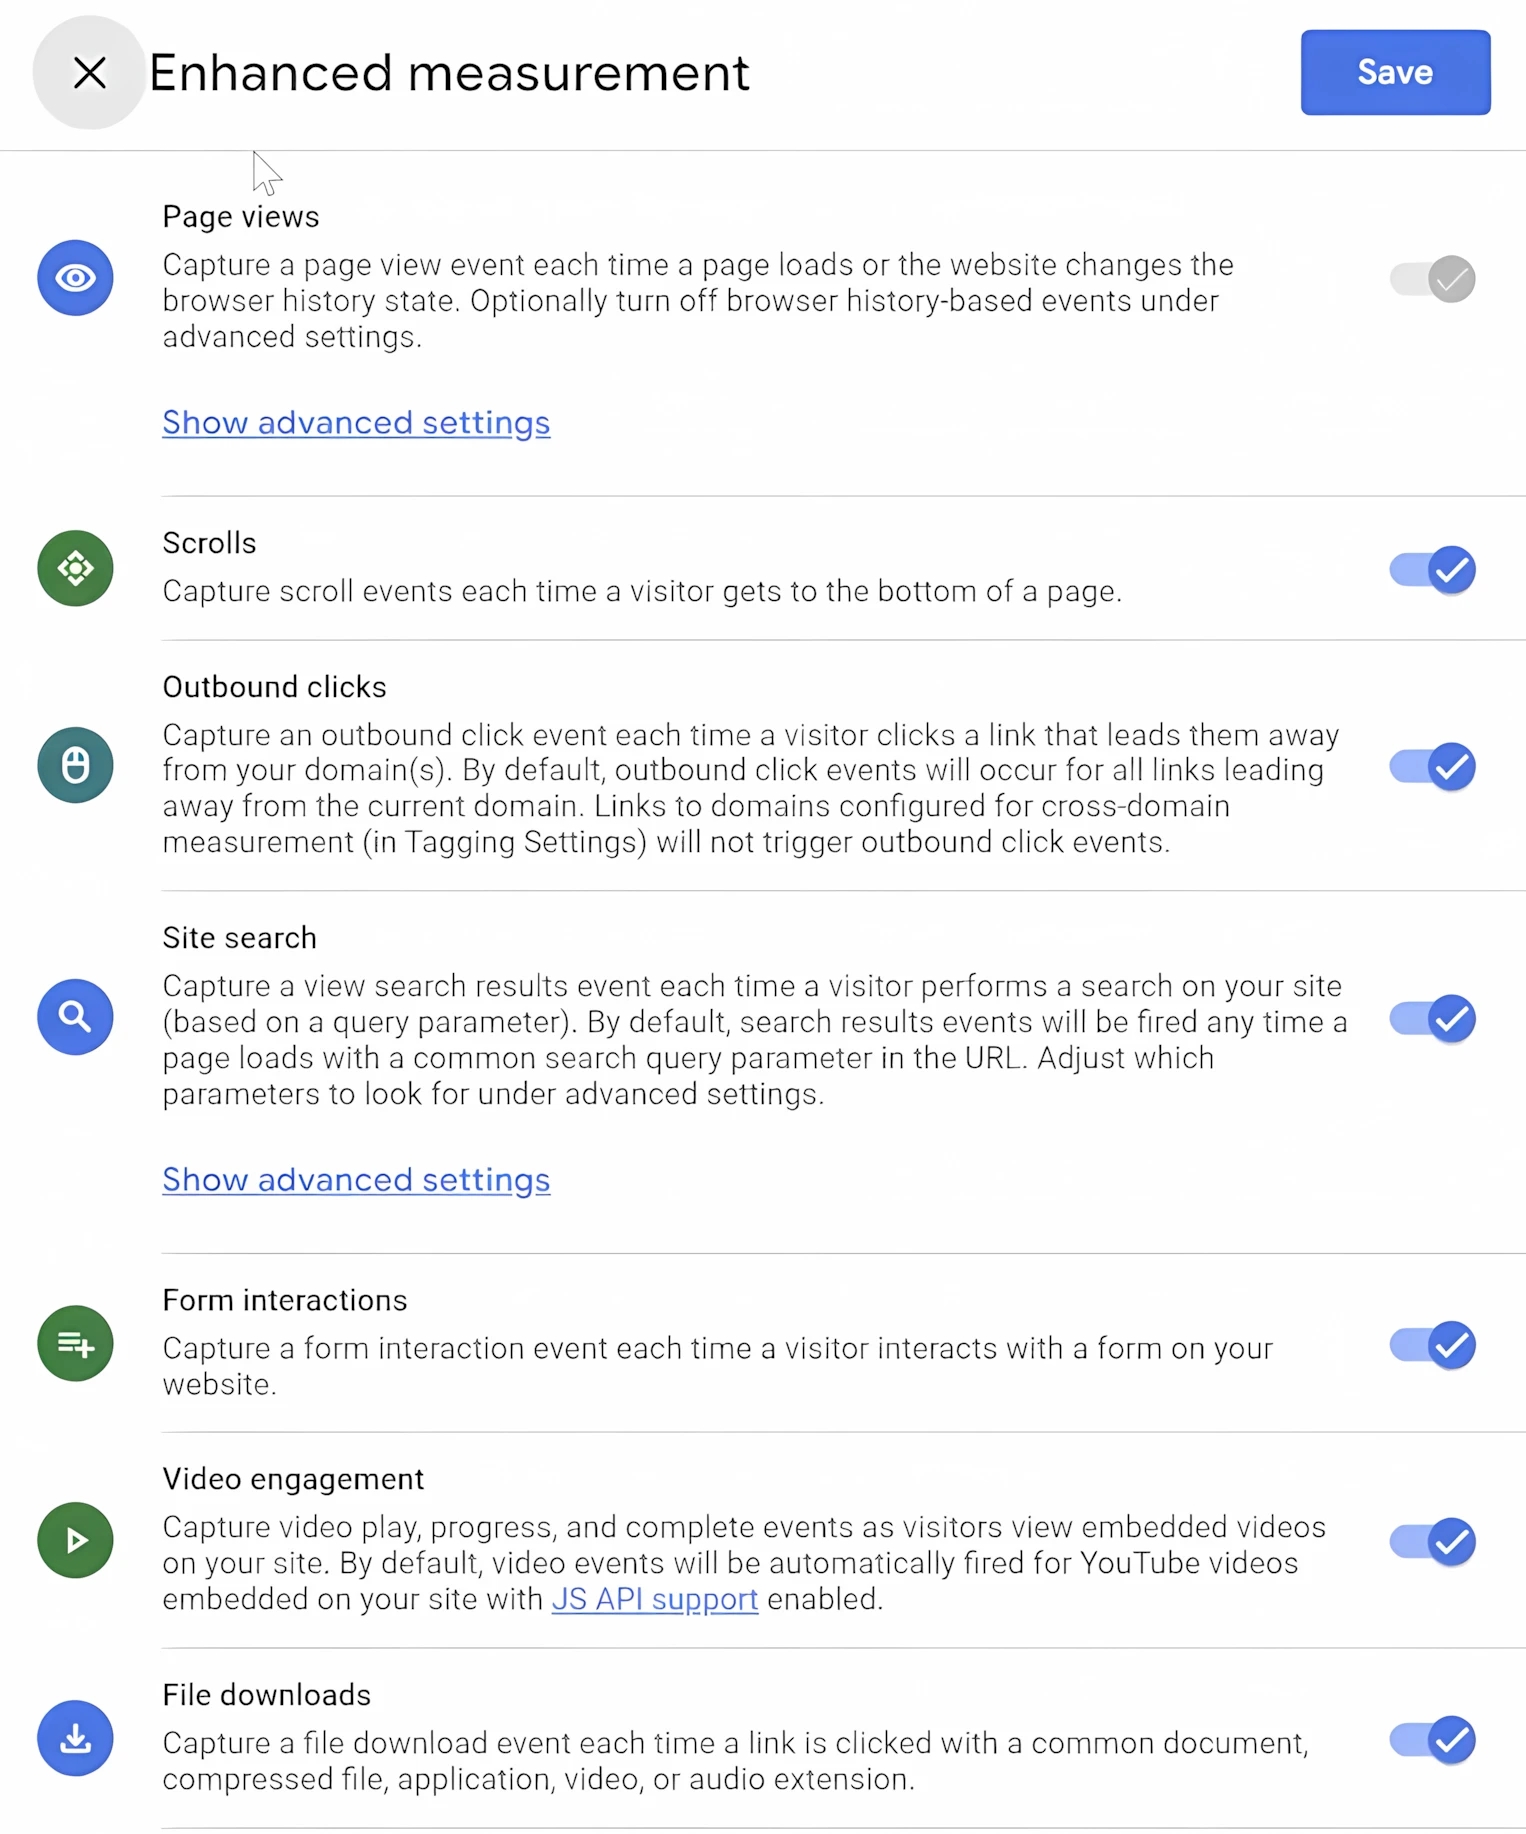
The list, as you can see, is significant, and all of them are tracked without additional actions on your part. Just check the appropriate switch. But there are two "buts":
- Unfortunately, Google did not import standard reports for this data (
- The name of the events does not always make it clear what exactly we are talking about. For example, it is not always immediately clear from the name Scrolls that it is meant to scroll the page by exactly 90%)
By the way, this article is just the beginning of a series of articles on advanced statistics events. Each such article will also be accompanied by a video instruction, so if you are more familiar with the video format, you can switch to it, but if you, like me, prefer the text version - read on.
Про що поговоримо:
- Where to find the
scrollevent and what it shows. - How to effectively analyze the
scrollevent: theScrolled usersmetric. - How to automatically calculate the percentage of users who scrolled the page by 90% or using Calculated Metrics in GA4.
- Creation of a custom report in the "Explore" block for scrolling analysis.
And here I leave a link to the video, if you still want to watch it.
Where to find the scroll event and what it shows
If you did not turn off the corresponding switch yourself, then by default you already have this event monitored. To check, go to Admin > Data collection and modification > Data streams > Select desired stream > Enhanced measurement
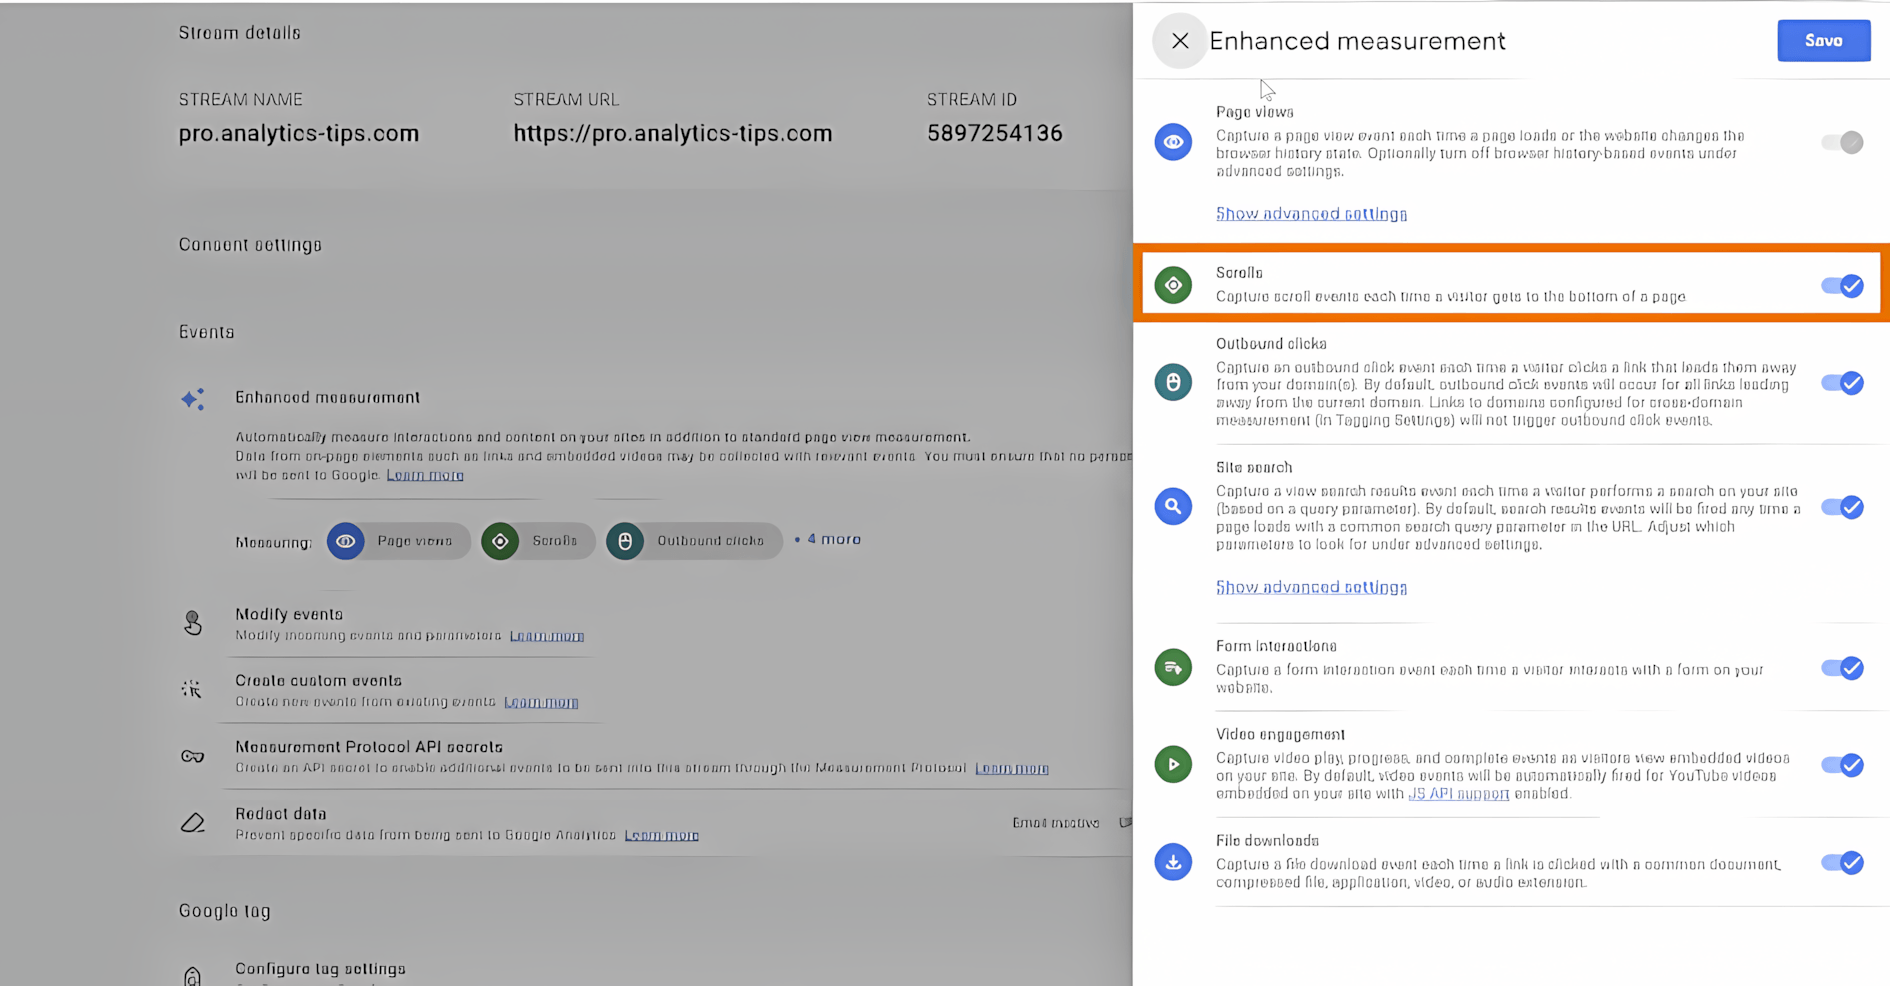
The event helps to track such a user action as scrolling the page by 90%. That is, the moment when the user reached almost the end of the page. The collected data will help us analyze what percentage of users viewed almost the entire page, and who dropped out earlier.
To find this event in the reports, go to the Reports > Engagement > Events tab and find Scroll in the table.
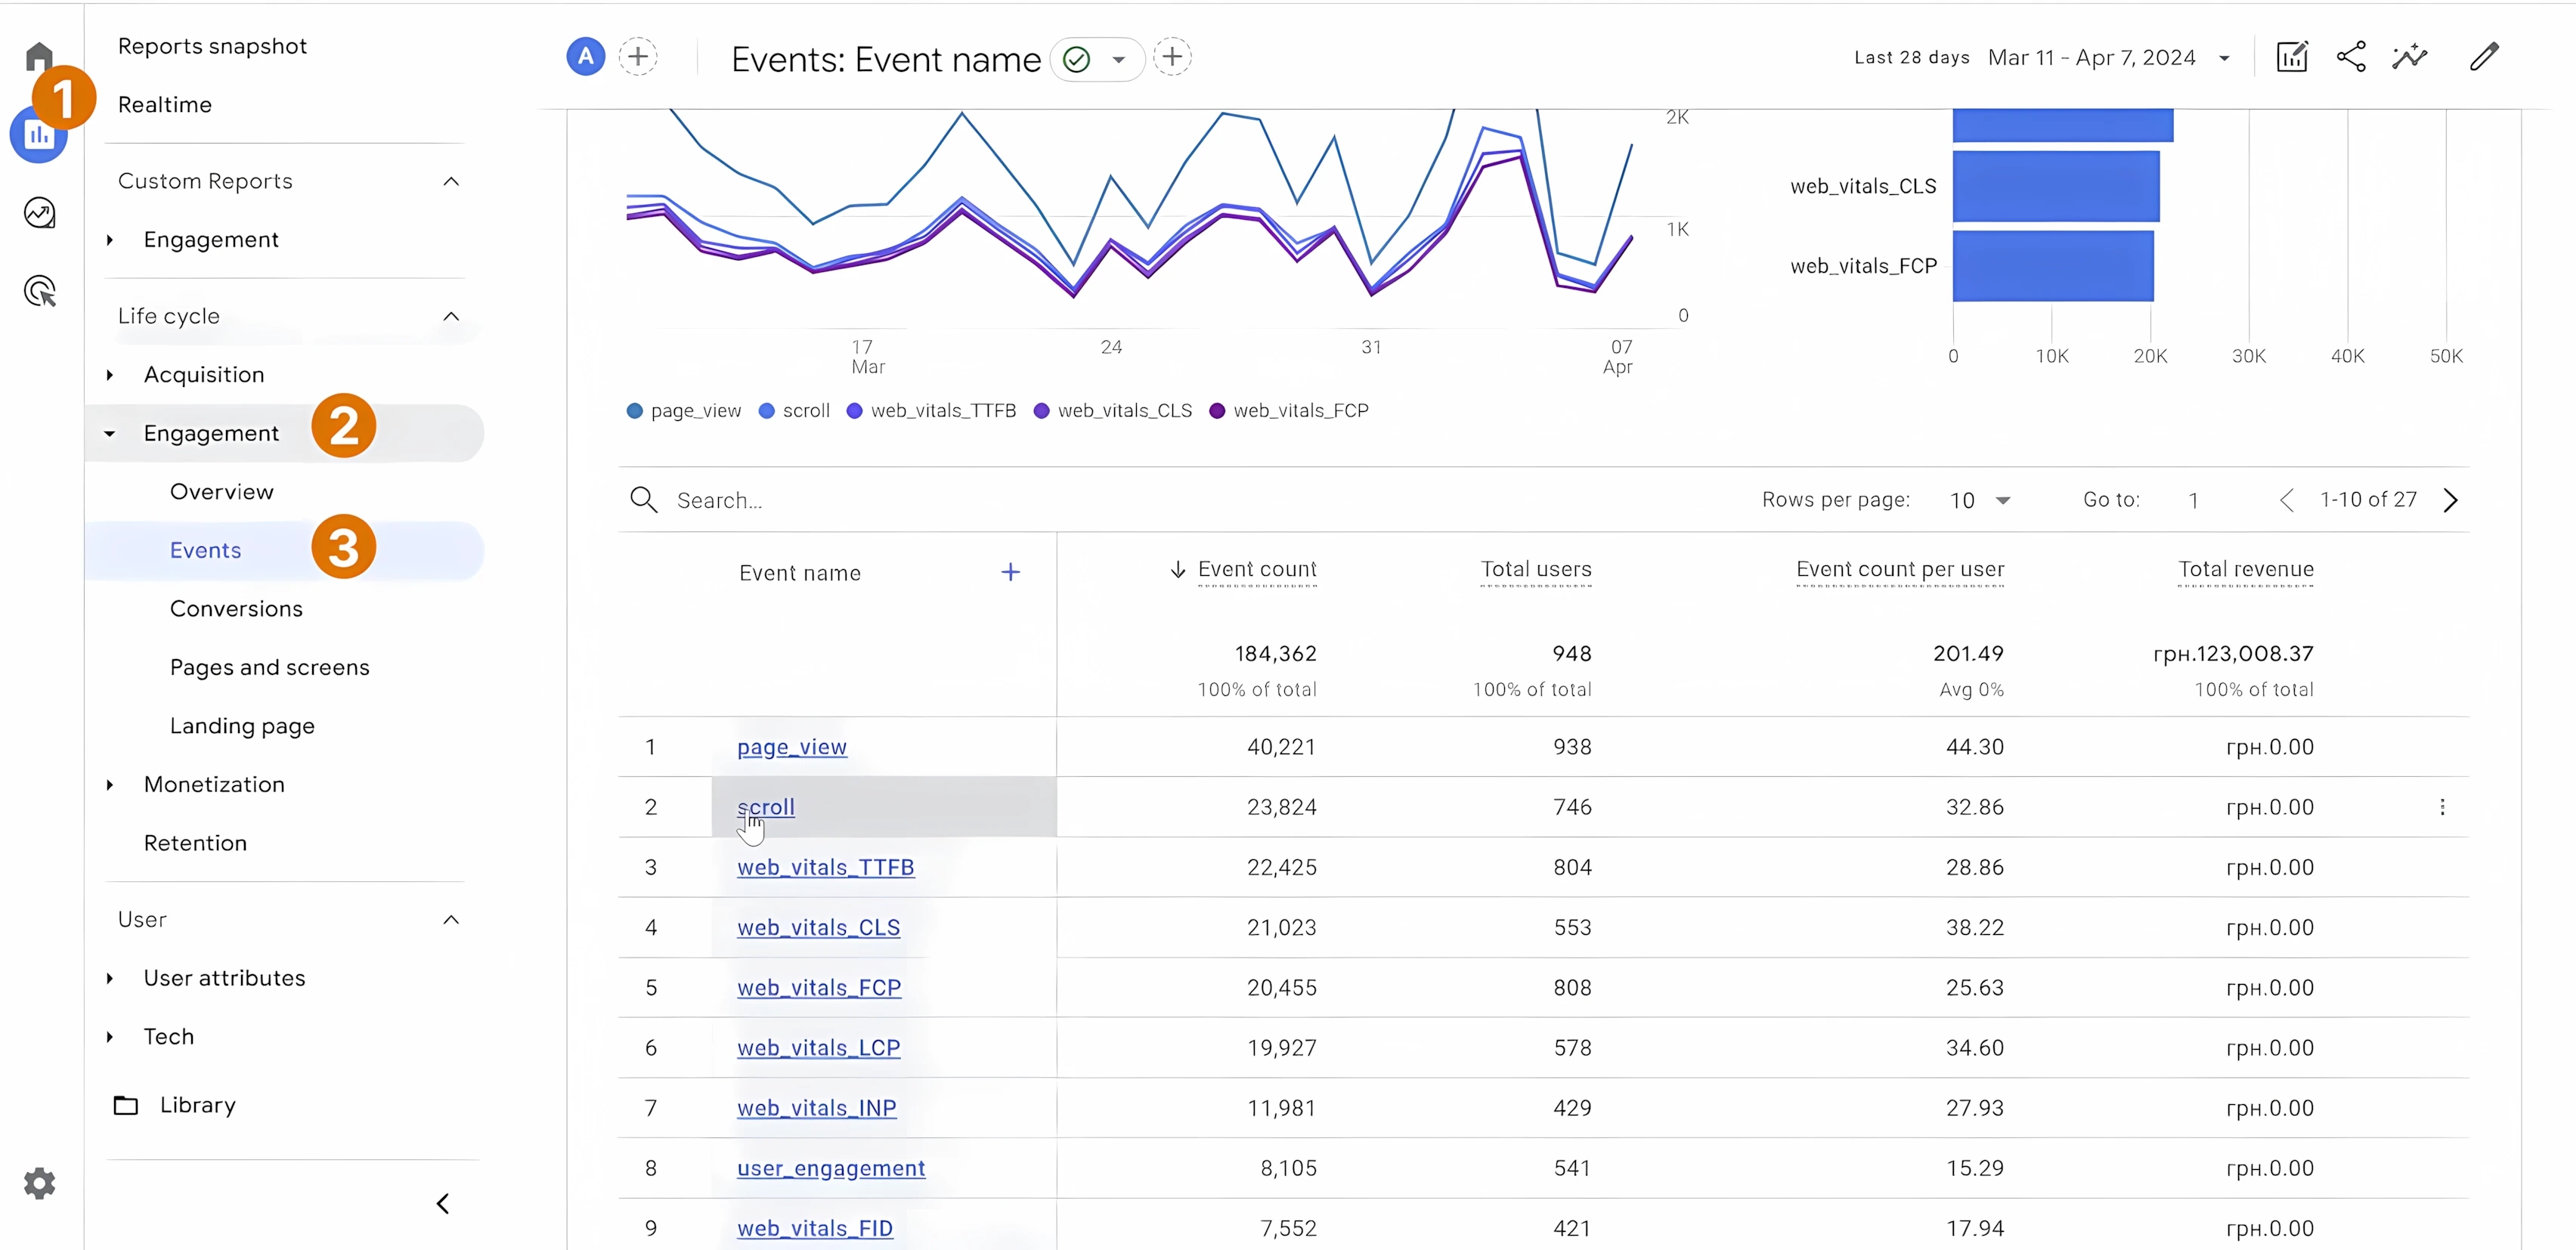
In the column, we can see how many times users performed this action (scrolled the page by 90%), but this does not give us enough information for a full analysis.
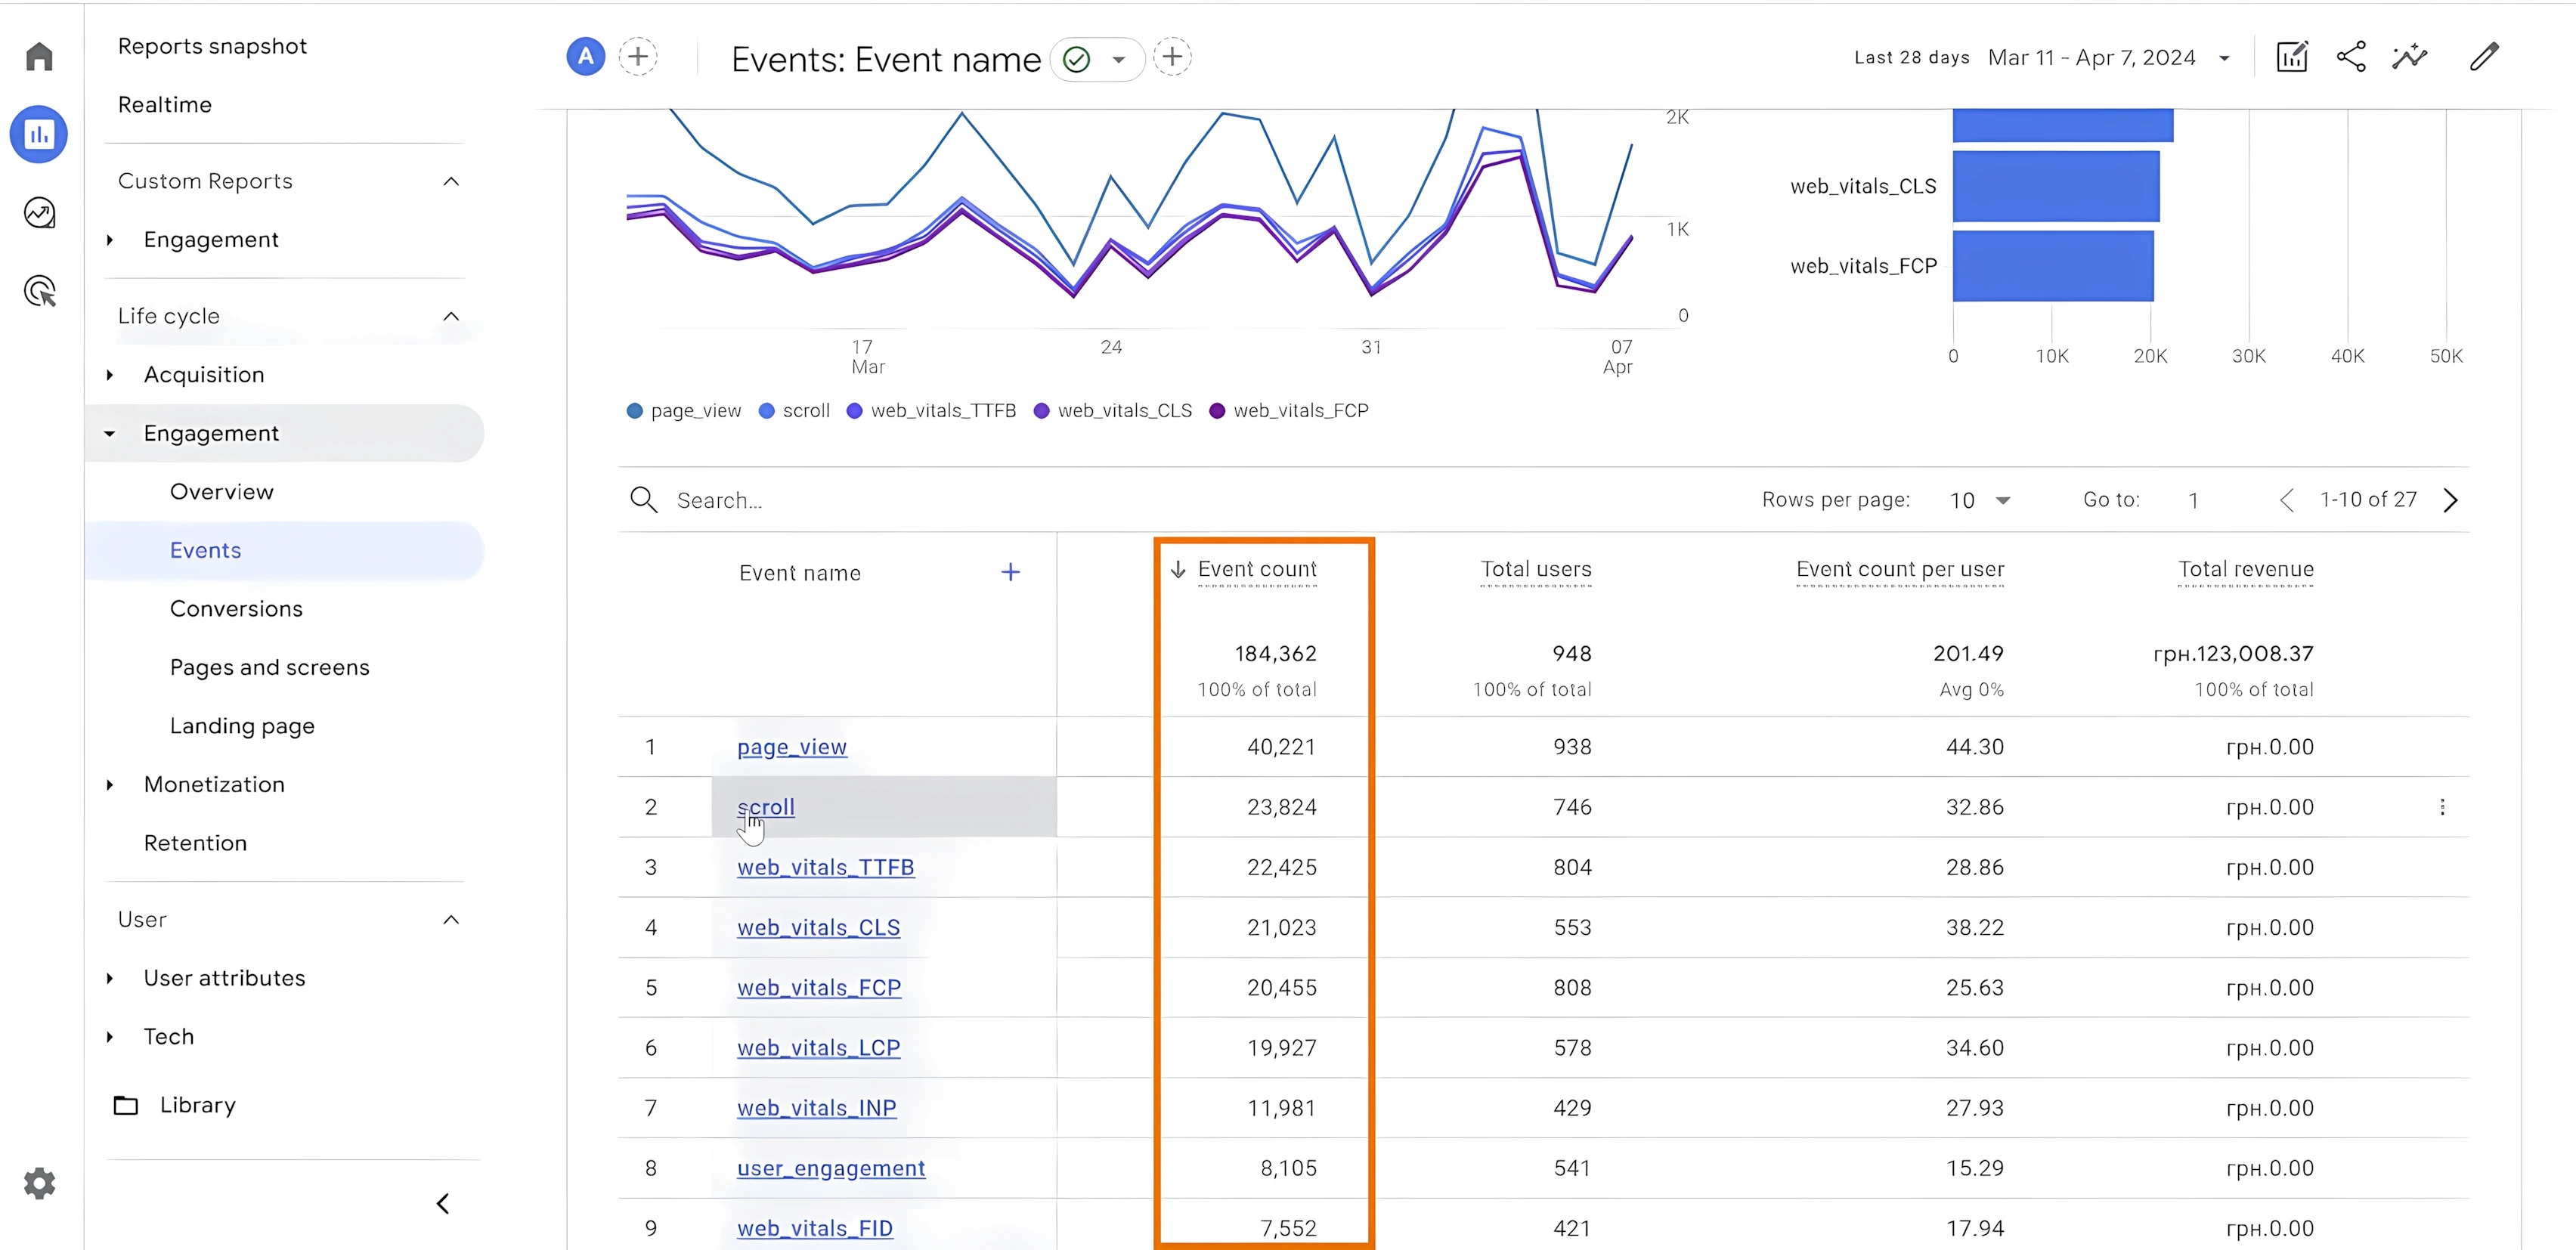
If we could see on which pages and how many times the Scroll event occurred, then, agree, it would be much more valuable information. So, in order to draw some meaningful conclusions, you need to go to another report called "Pages and Screens".
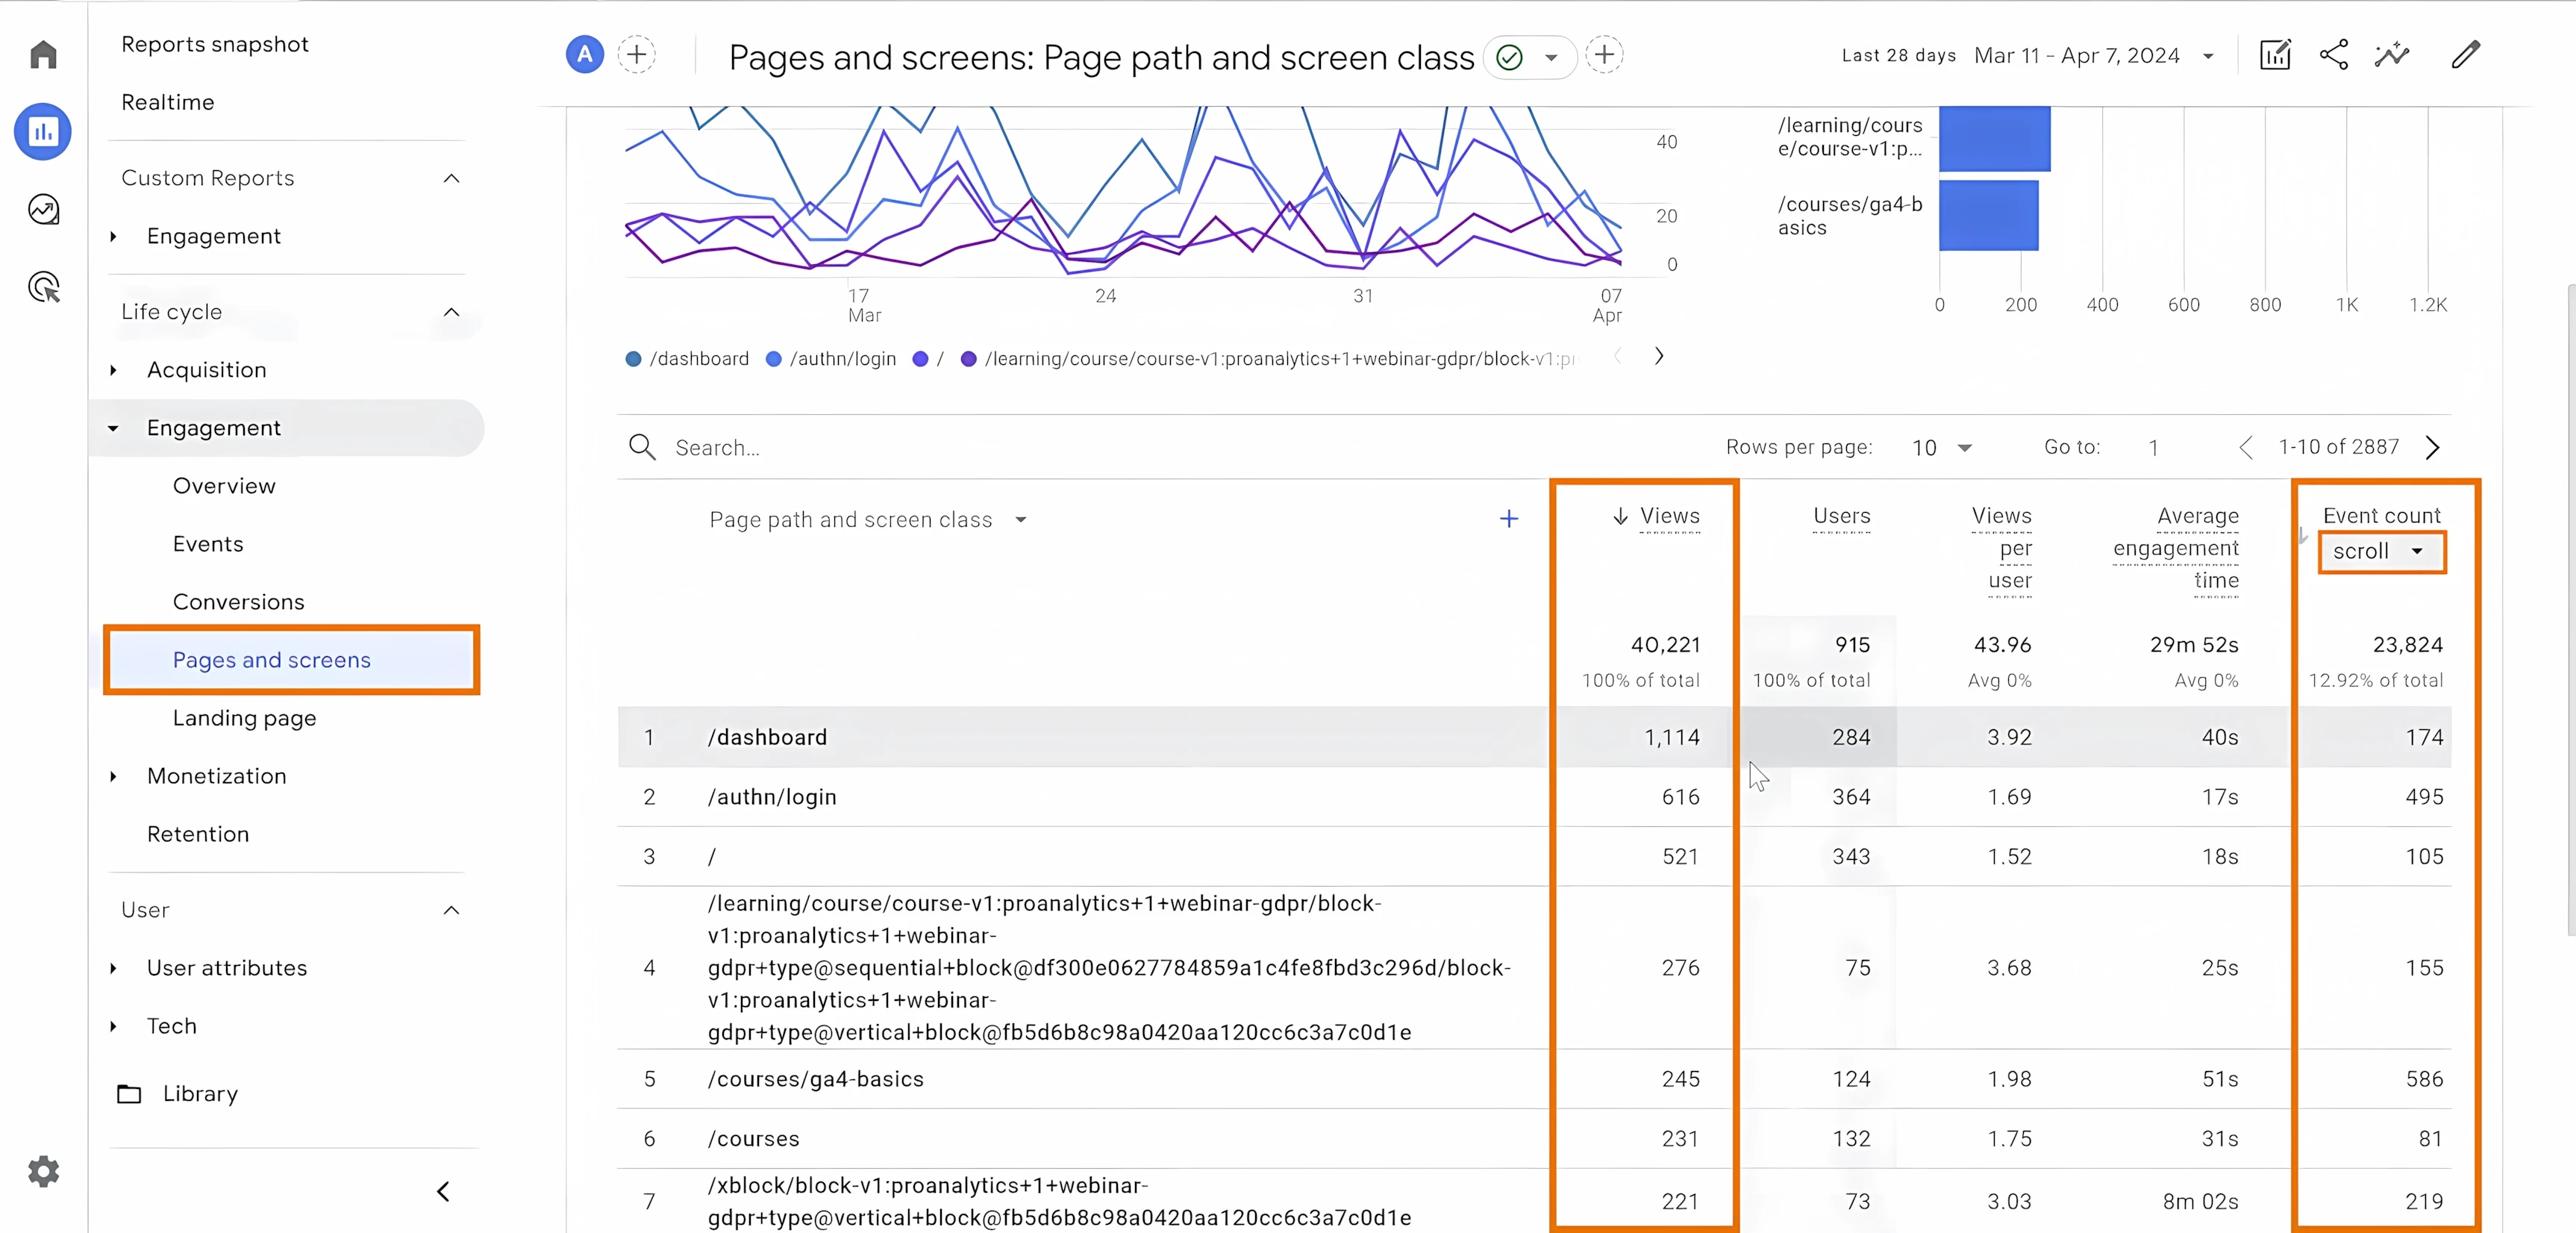
Here we see information linked to specific pages. If we select the Scroll event in the "Event Count" column in the drop-down list, then we can already compare the number of page scrolls at 90% Event Count: Scroll with the total number of views of a particular page Views. And if we divide the first indicator by the second, we will find out what percentage of views end with a page scrolling of 90% or more. In our case, it is about 16%.
But GA4 provides much more opportunities for analyzing such interactions. Let's consider them too.
How to effectively analyze the scroll event: the Scrolled users metric.
In the example above, we see only the number of times when the user performed the event, but not the number of these users. More important conclusions can be drawn by knowing exactly the percentage of users who have scrolled the page by 90%. Let's output this information:
- Go to the editing mode (Custom report).
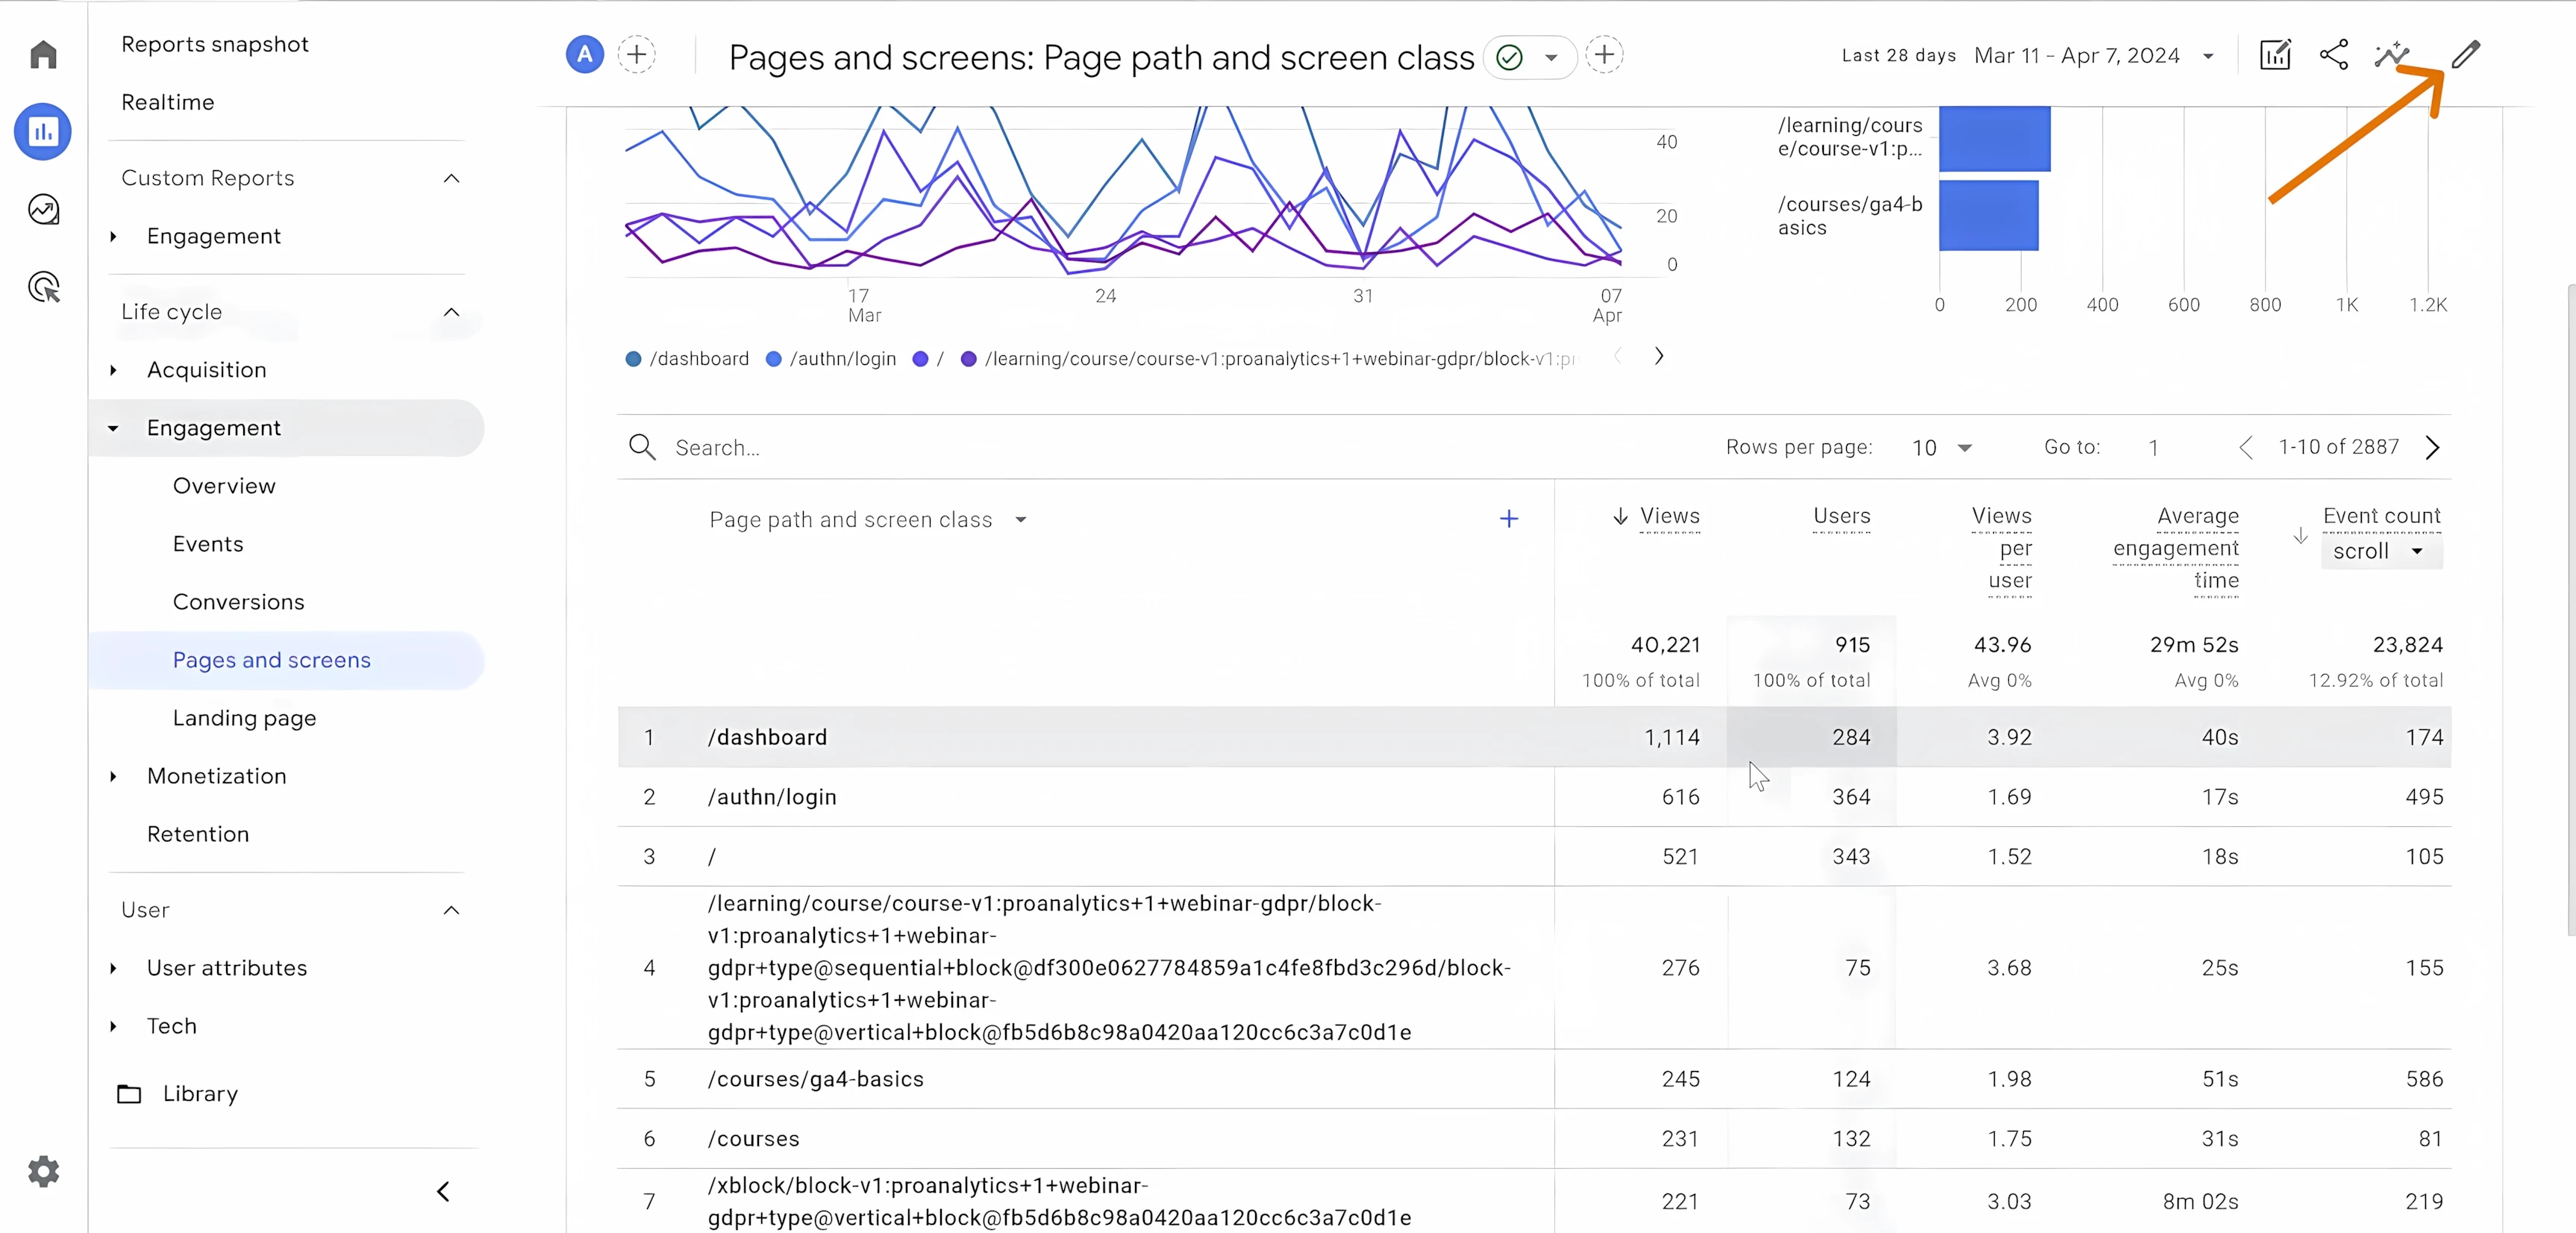
2. In the "Metrics", we are looking for the Scrolled users indicator.
3. Click "Apply".
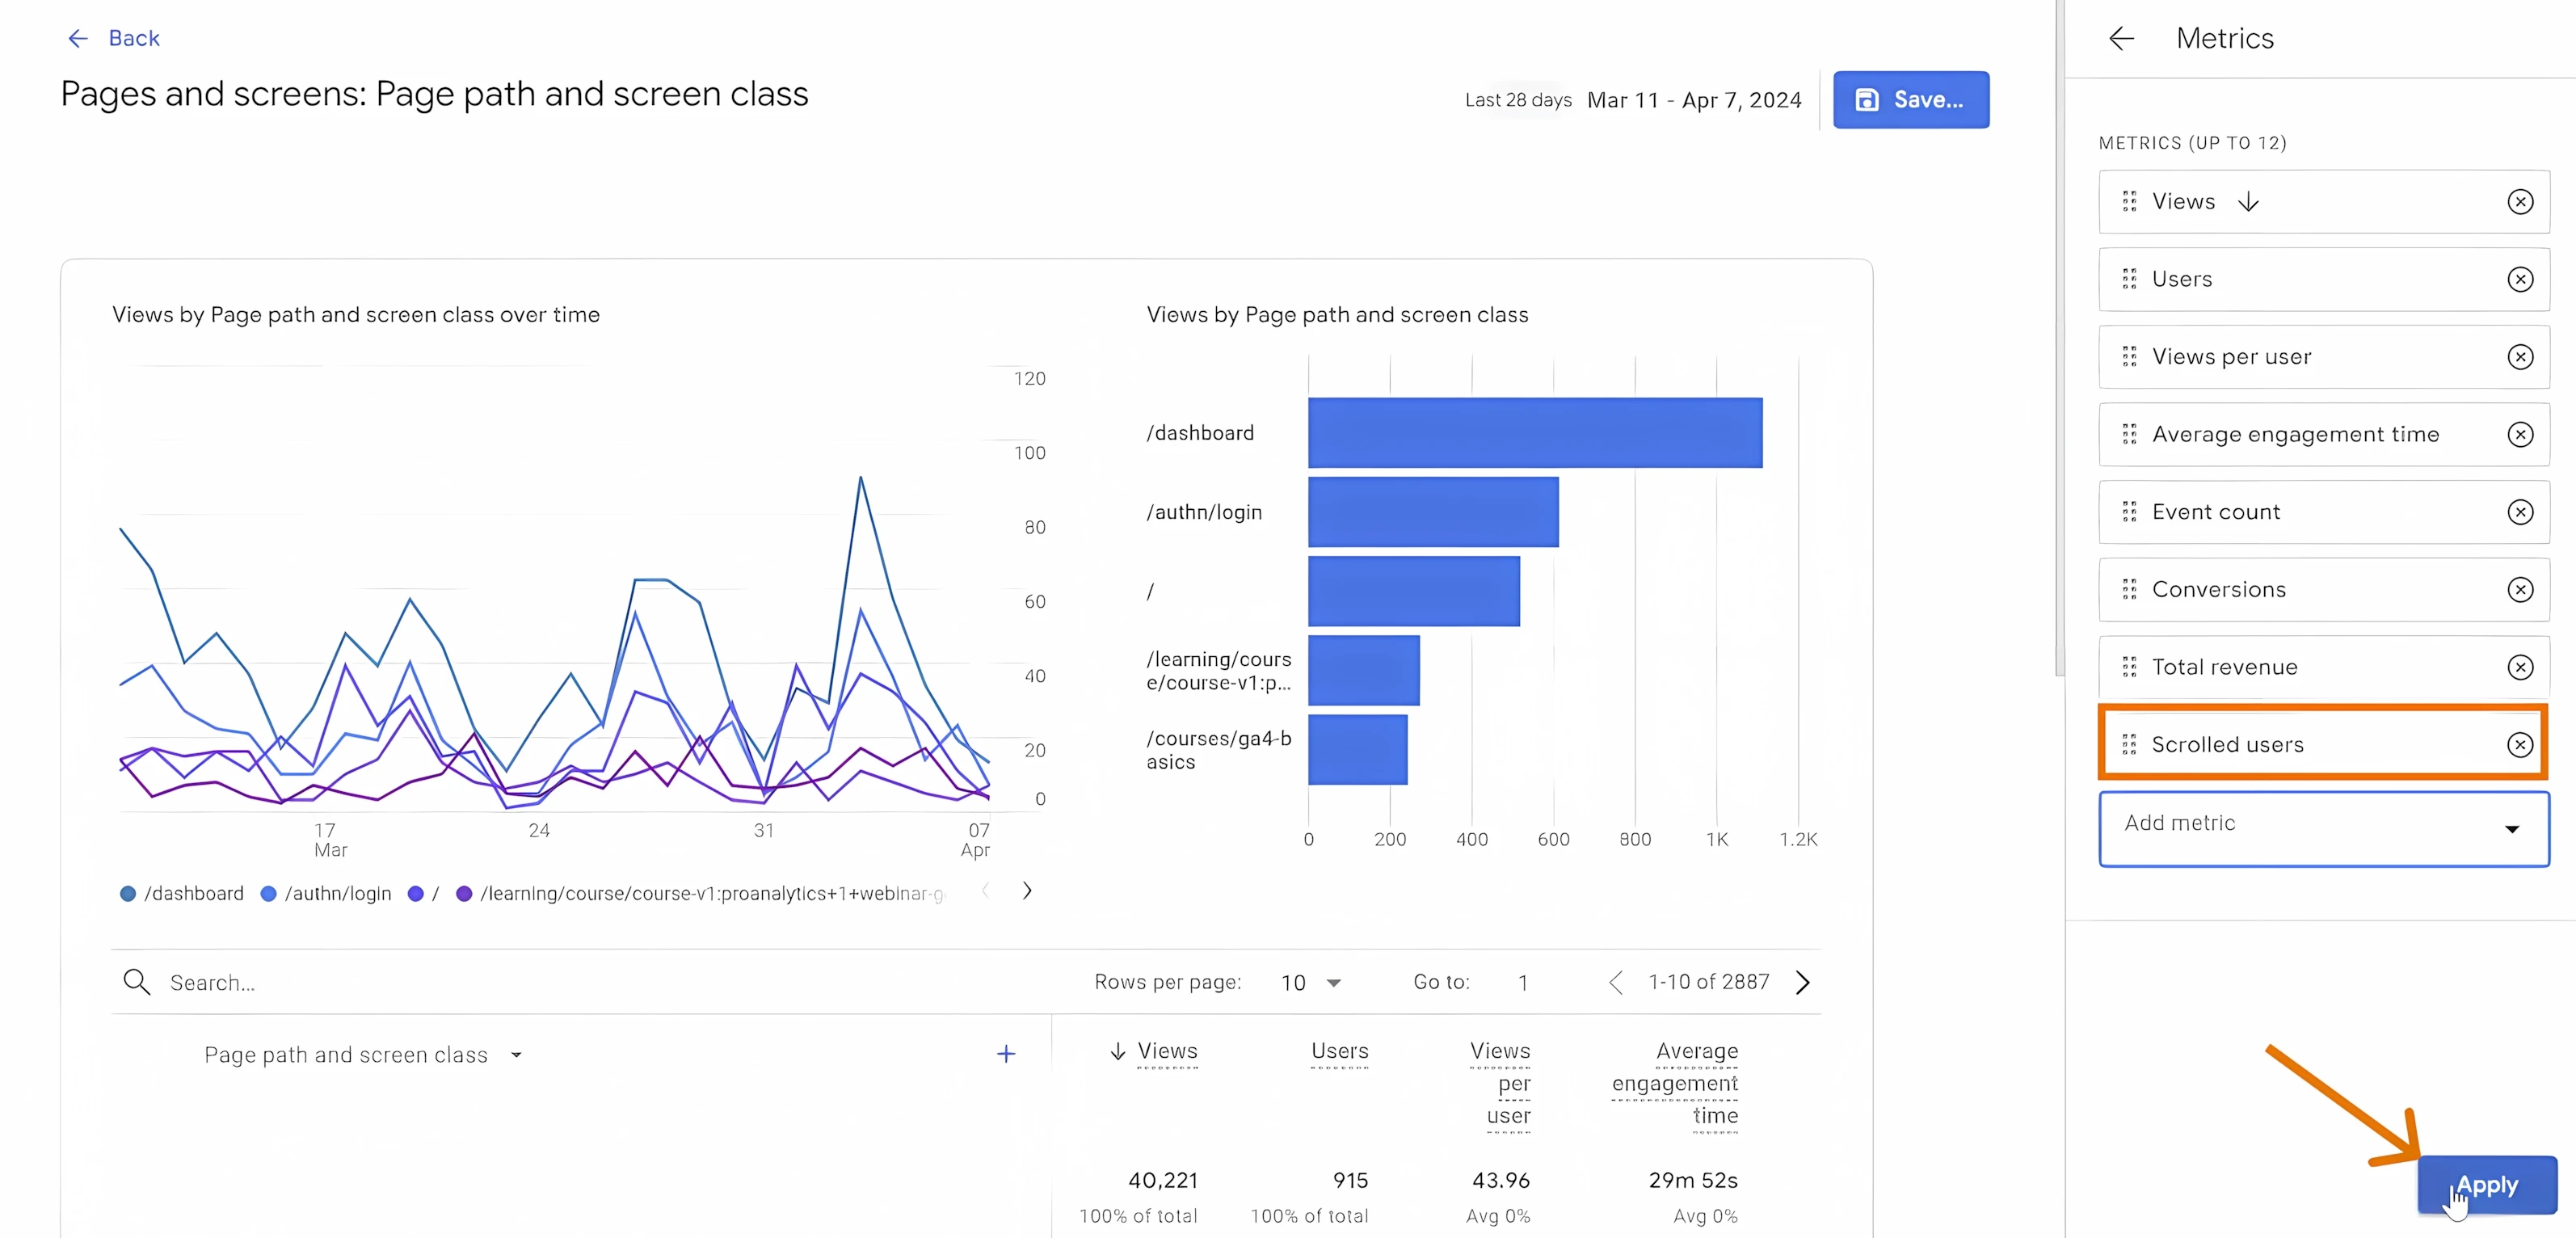
Now let's analyze the very first page /dashboard.
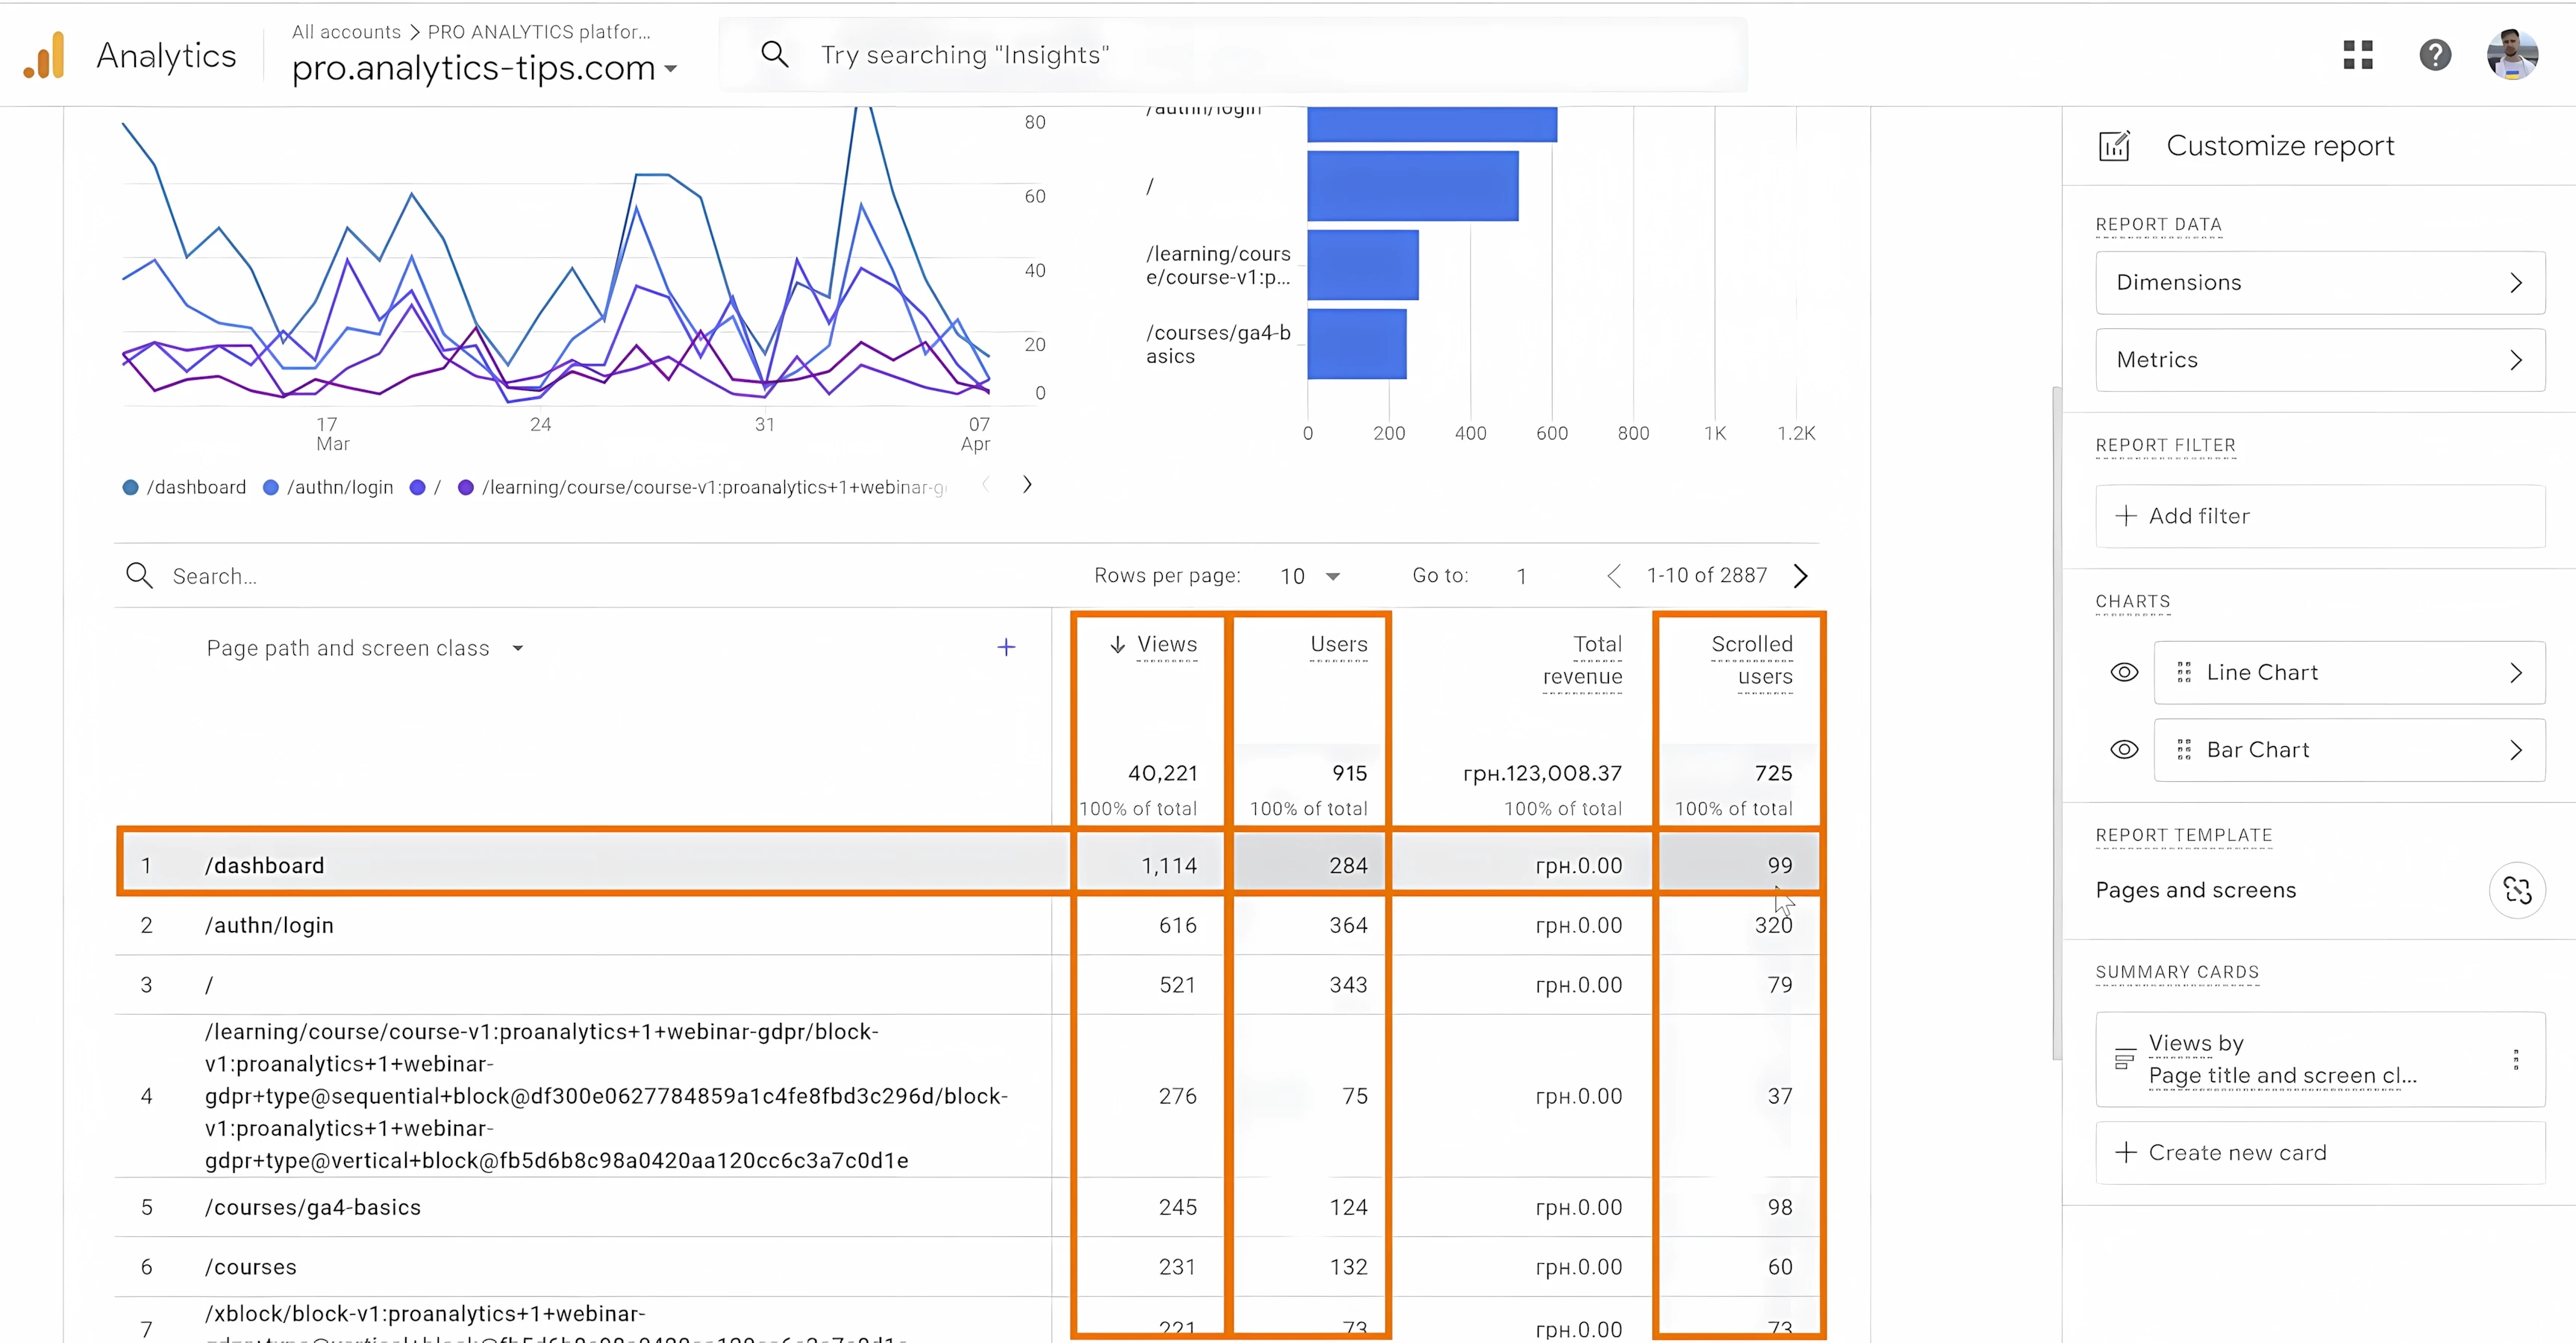
On the screen we can see that the total number of views of the page is 1114, but only 284 users made such a number of views. Of them, 99 users scrolled the page to 90%. That is, in general, about 35%. As you can see, 35% is significantly higher than the 16% we got when we analyzed the percentage of page views that end in a Scroll event.
If in the case of page views 16% looked more like a disaster, then in the case of users we see that about a third view the page almost completely. Of course, users who view the page repeatedly do not have to scroll it completely, they can search for the necessary information, which can be found anywhere on the page. Therefore, it is better to analyze users.
How to automatically calculate the percentage of users who scrolled the page by 90% or using Calculated Metrics in GA4
If we want to compare the difference between several pages, then even with the addition of the additional indicator Scrolled users, we will see the following:
- on one page, 99 out of 284 visitors scrolled by 90%,
- and on the other - 98 visitors out of 194.
It does not seem very clear which of these pages will be scrolled better. To determine this, you need to manually divide one number by another and present them as a percentage. But you and I are lazy people, so let's do the manual work. For this we will need "Calculated Metrics".
To create a calculated metric, go to Admin > Data display > Custom definitions > Calculated Metrics
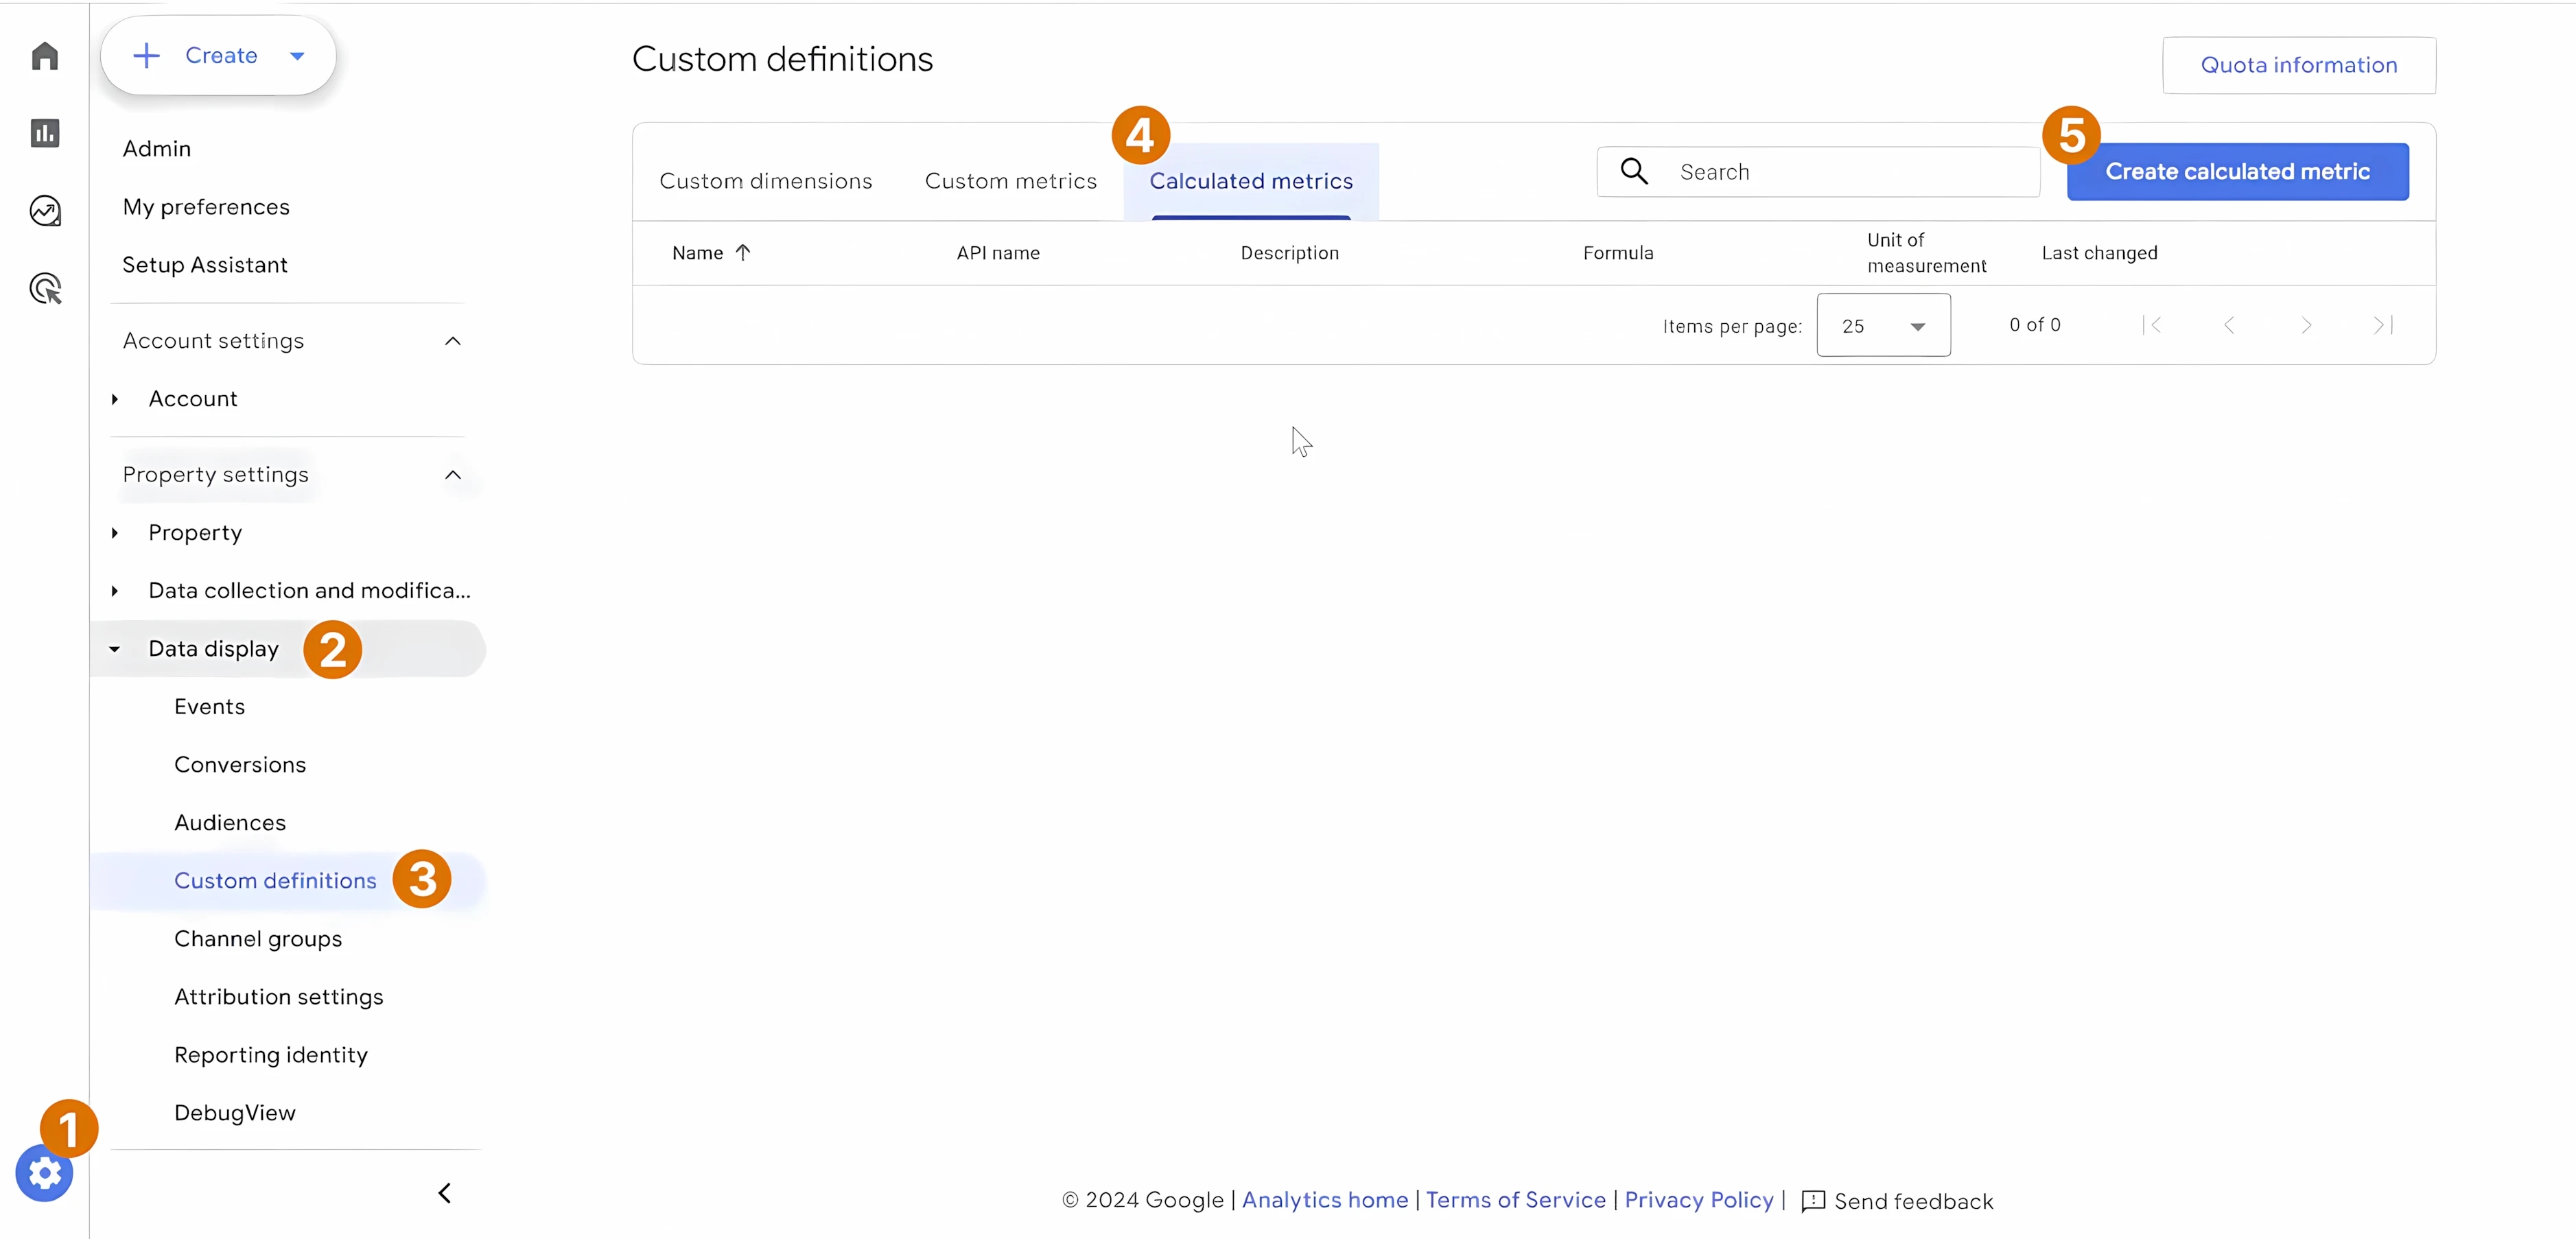
and then take the following steps:
- Click "Create calculated metric".
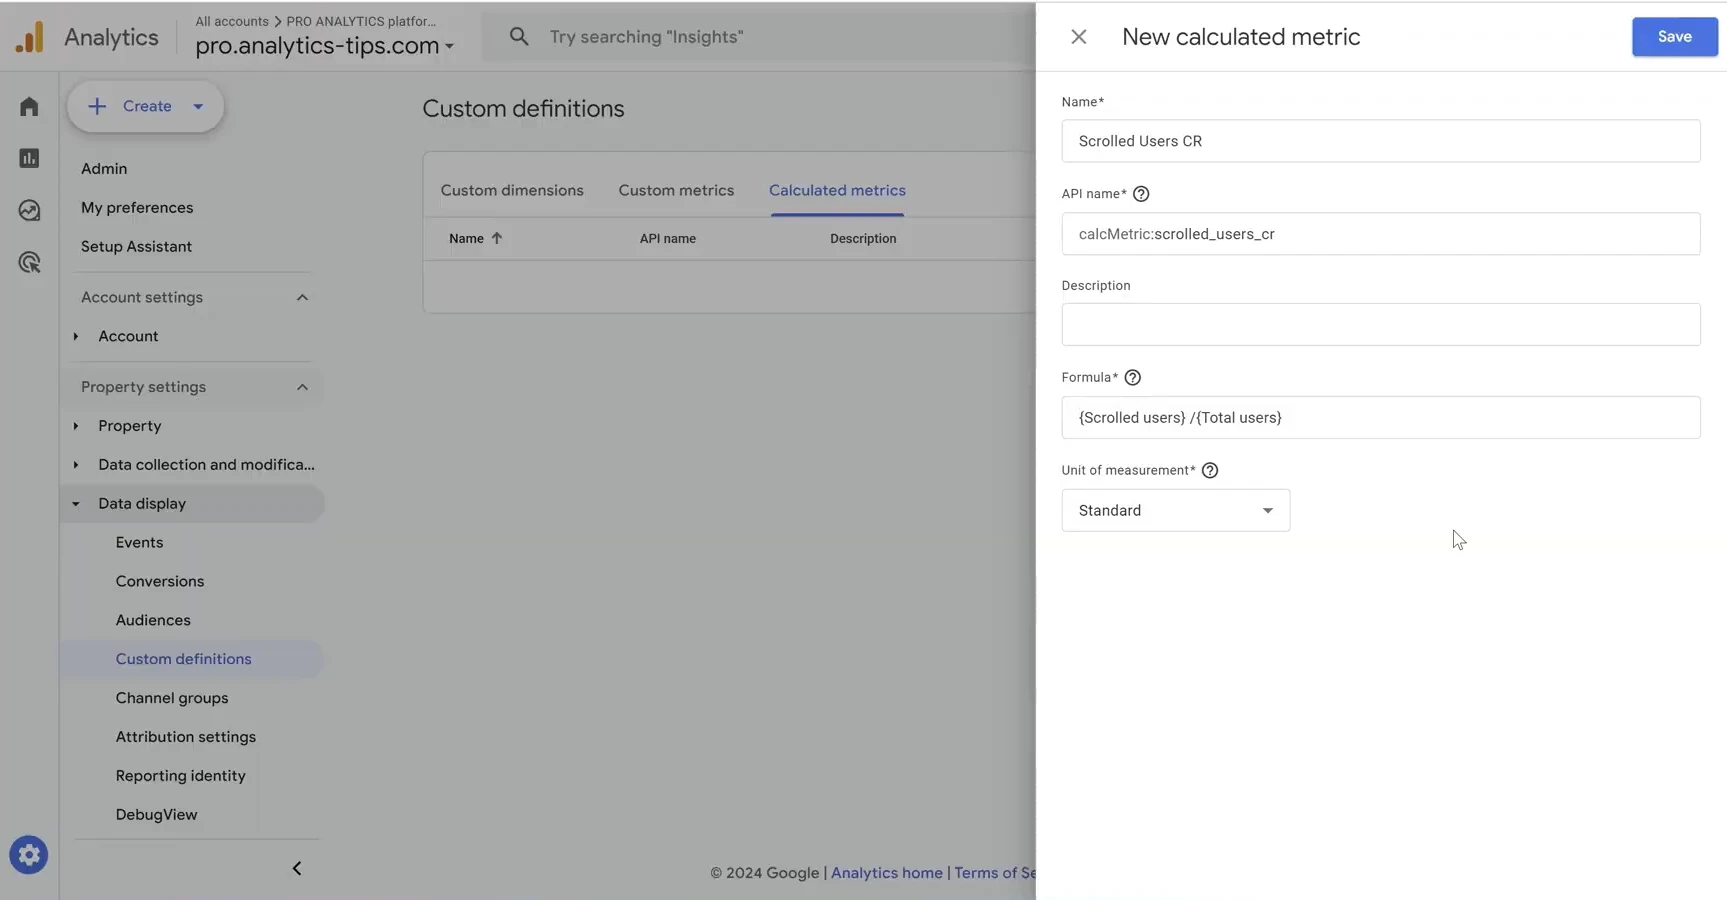
- Enter the name Scrolled Users Conversion Rate (Scrolled Users CR).
- Write the formula "
Scrolled users/Total users". Please note that the names of the indicators will be in curly brackets - this is normal. - We select the item "Unit of measurement" and leave it as it is, because, unfortunately, there is no possibility to choose percentages there.
- Click "Save".
Then we return to the "Pages and Screens" report and add our created Scrolled Users CR metric in the "Metrics" block of the "Custom report", similar to how we did it earlier with the addition of Scrolled users. And now a new metric has appeared in the table, showing the percentage value.
Please note that the indicator will show data in the format of percentages from 1, since the calculated indicators do not currently support normal percentages.
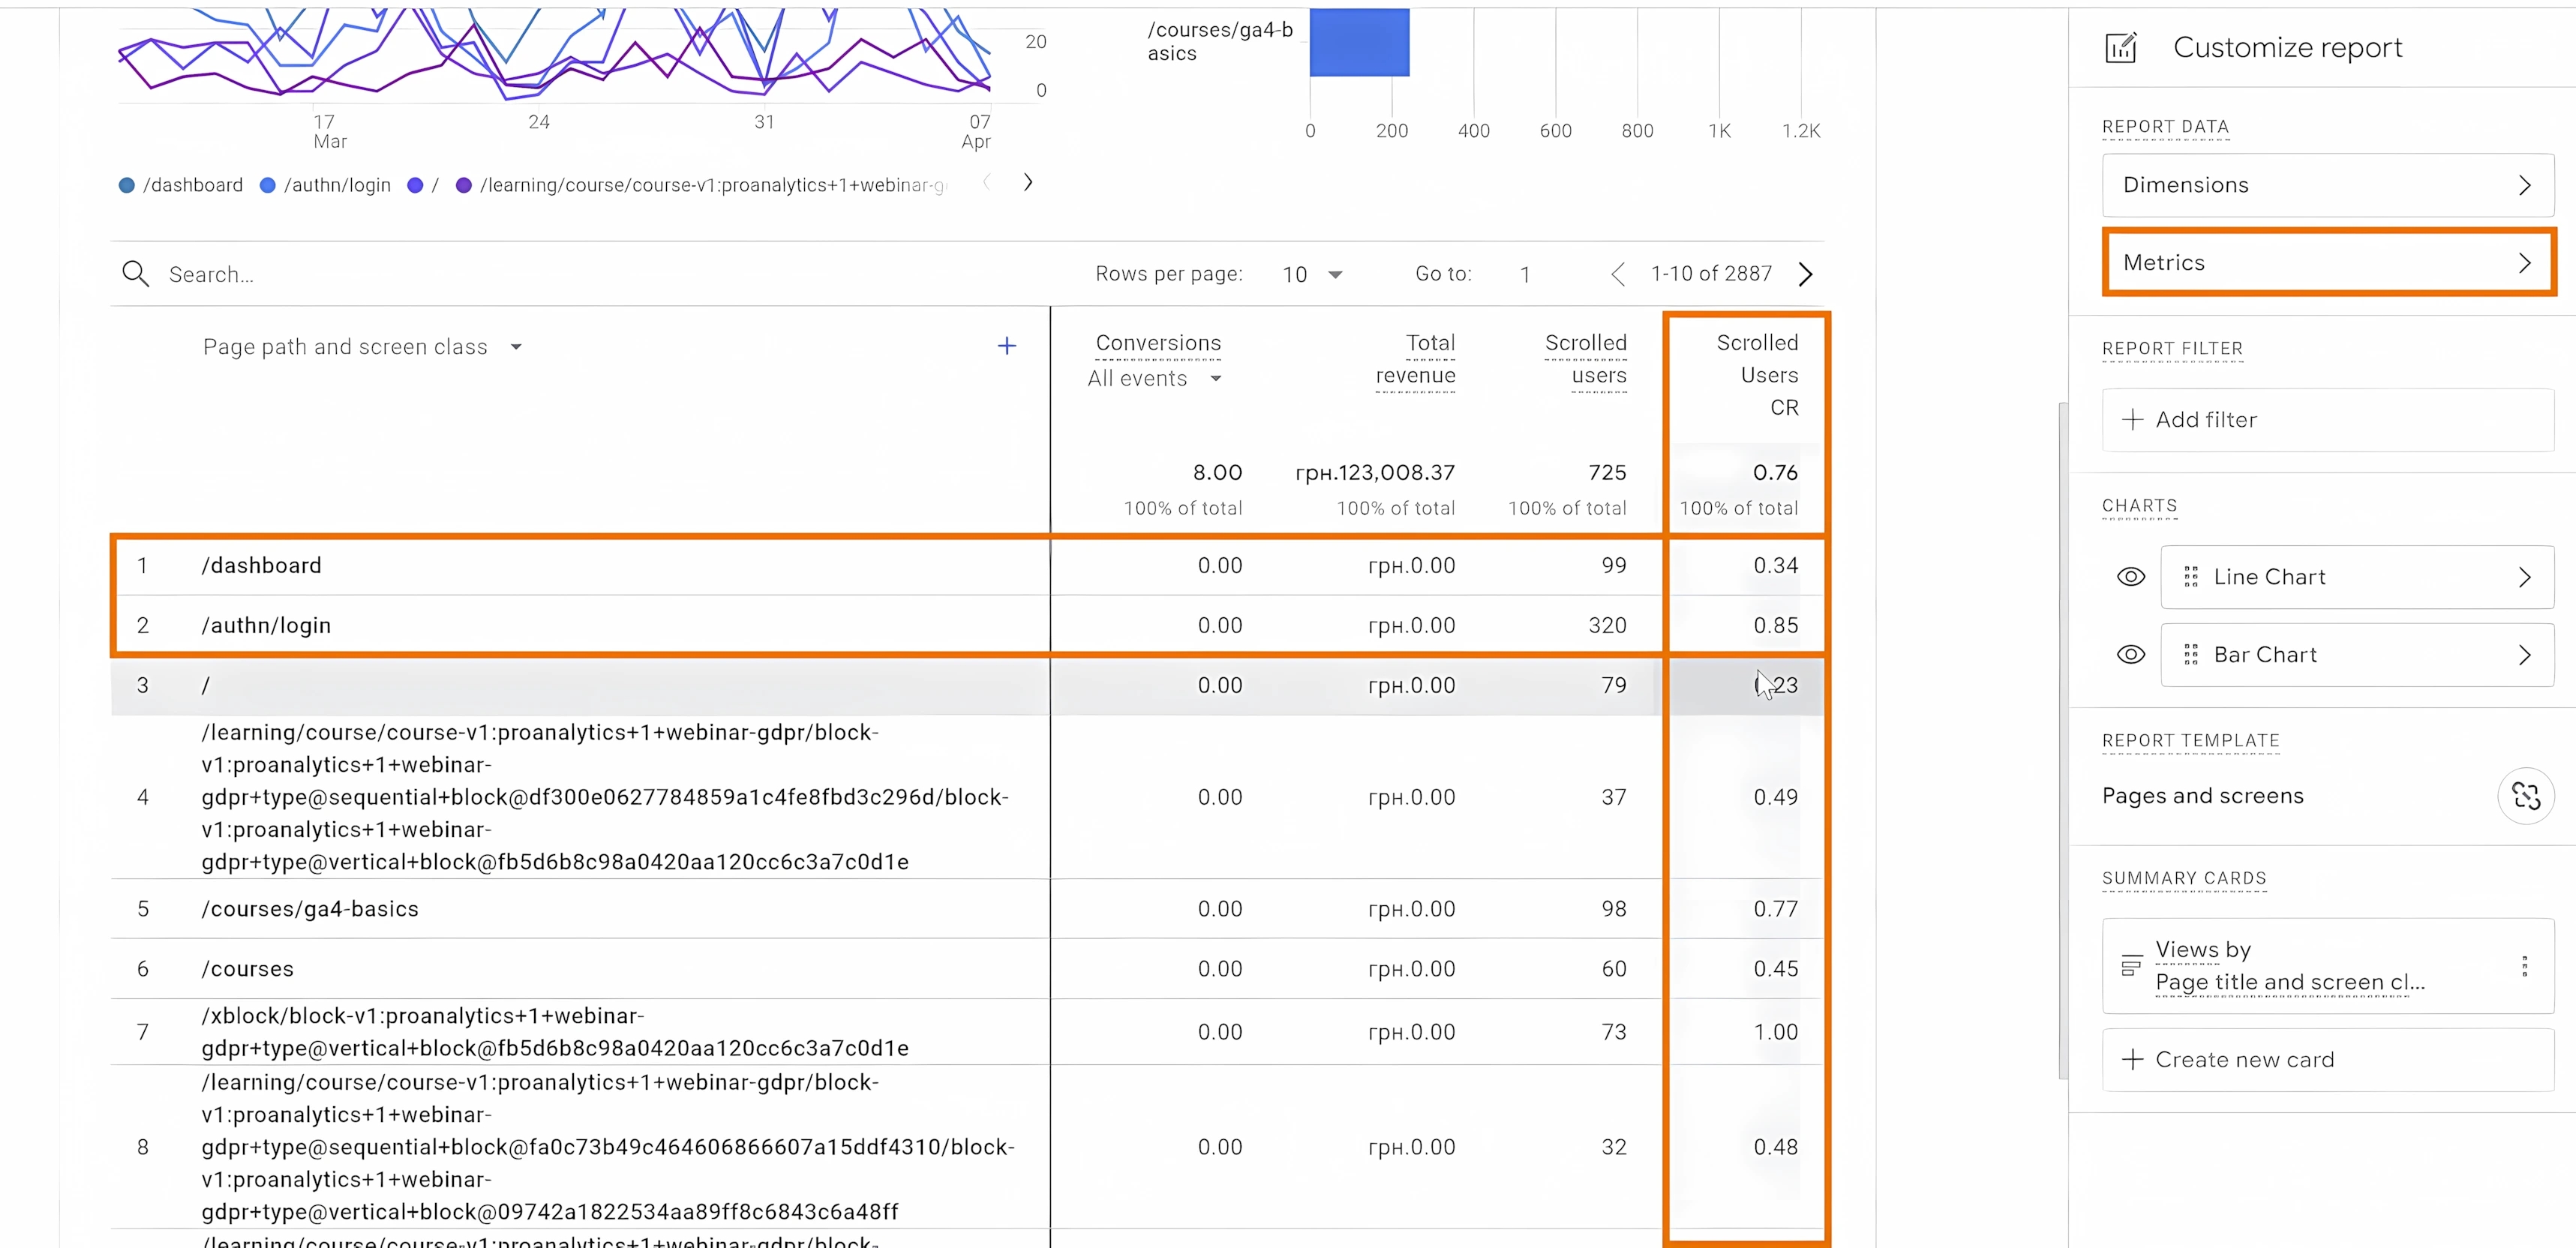
If we return to the question from the beginning of this block, now it has become much more convenient to analyze, and we can quickly see which of the two pages visitors scroll through 90% more often.
Creation of a custom report in the "Explore" block for scrolling analysis
But that's not all. OK, we saw that 34% of users viewed the /dashboard page 90% or more, but are you curious to know what happened to the other 66%? At what stage of interaction with the page did they fall off?
To analyze this information, the standard Scroll event will not be enough. Here you will first need to configure the transmission of custom events. But the result will clearly answer the question "At what stage of interaction with the page did you lose your visitors." You can read more about how to do this in the article - Track scrolling on pages using Google Tag Manager: An advanced guide
The final report with the following additional settings will look like this:
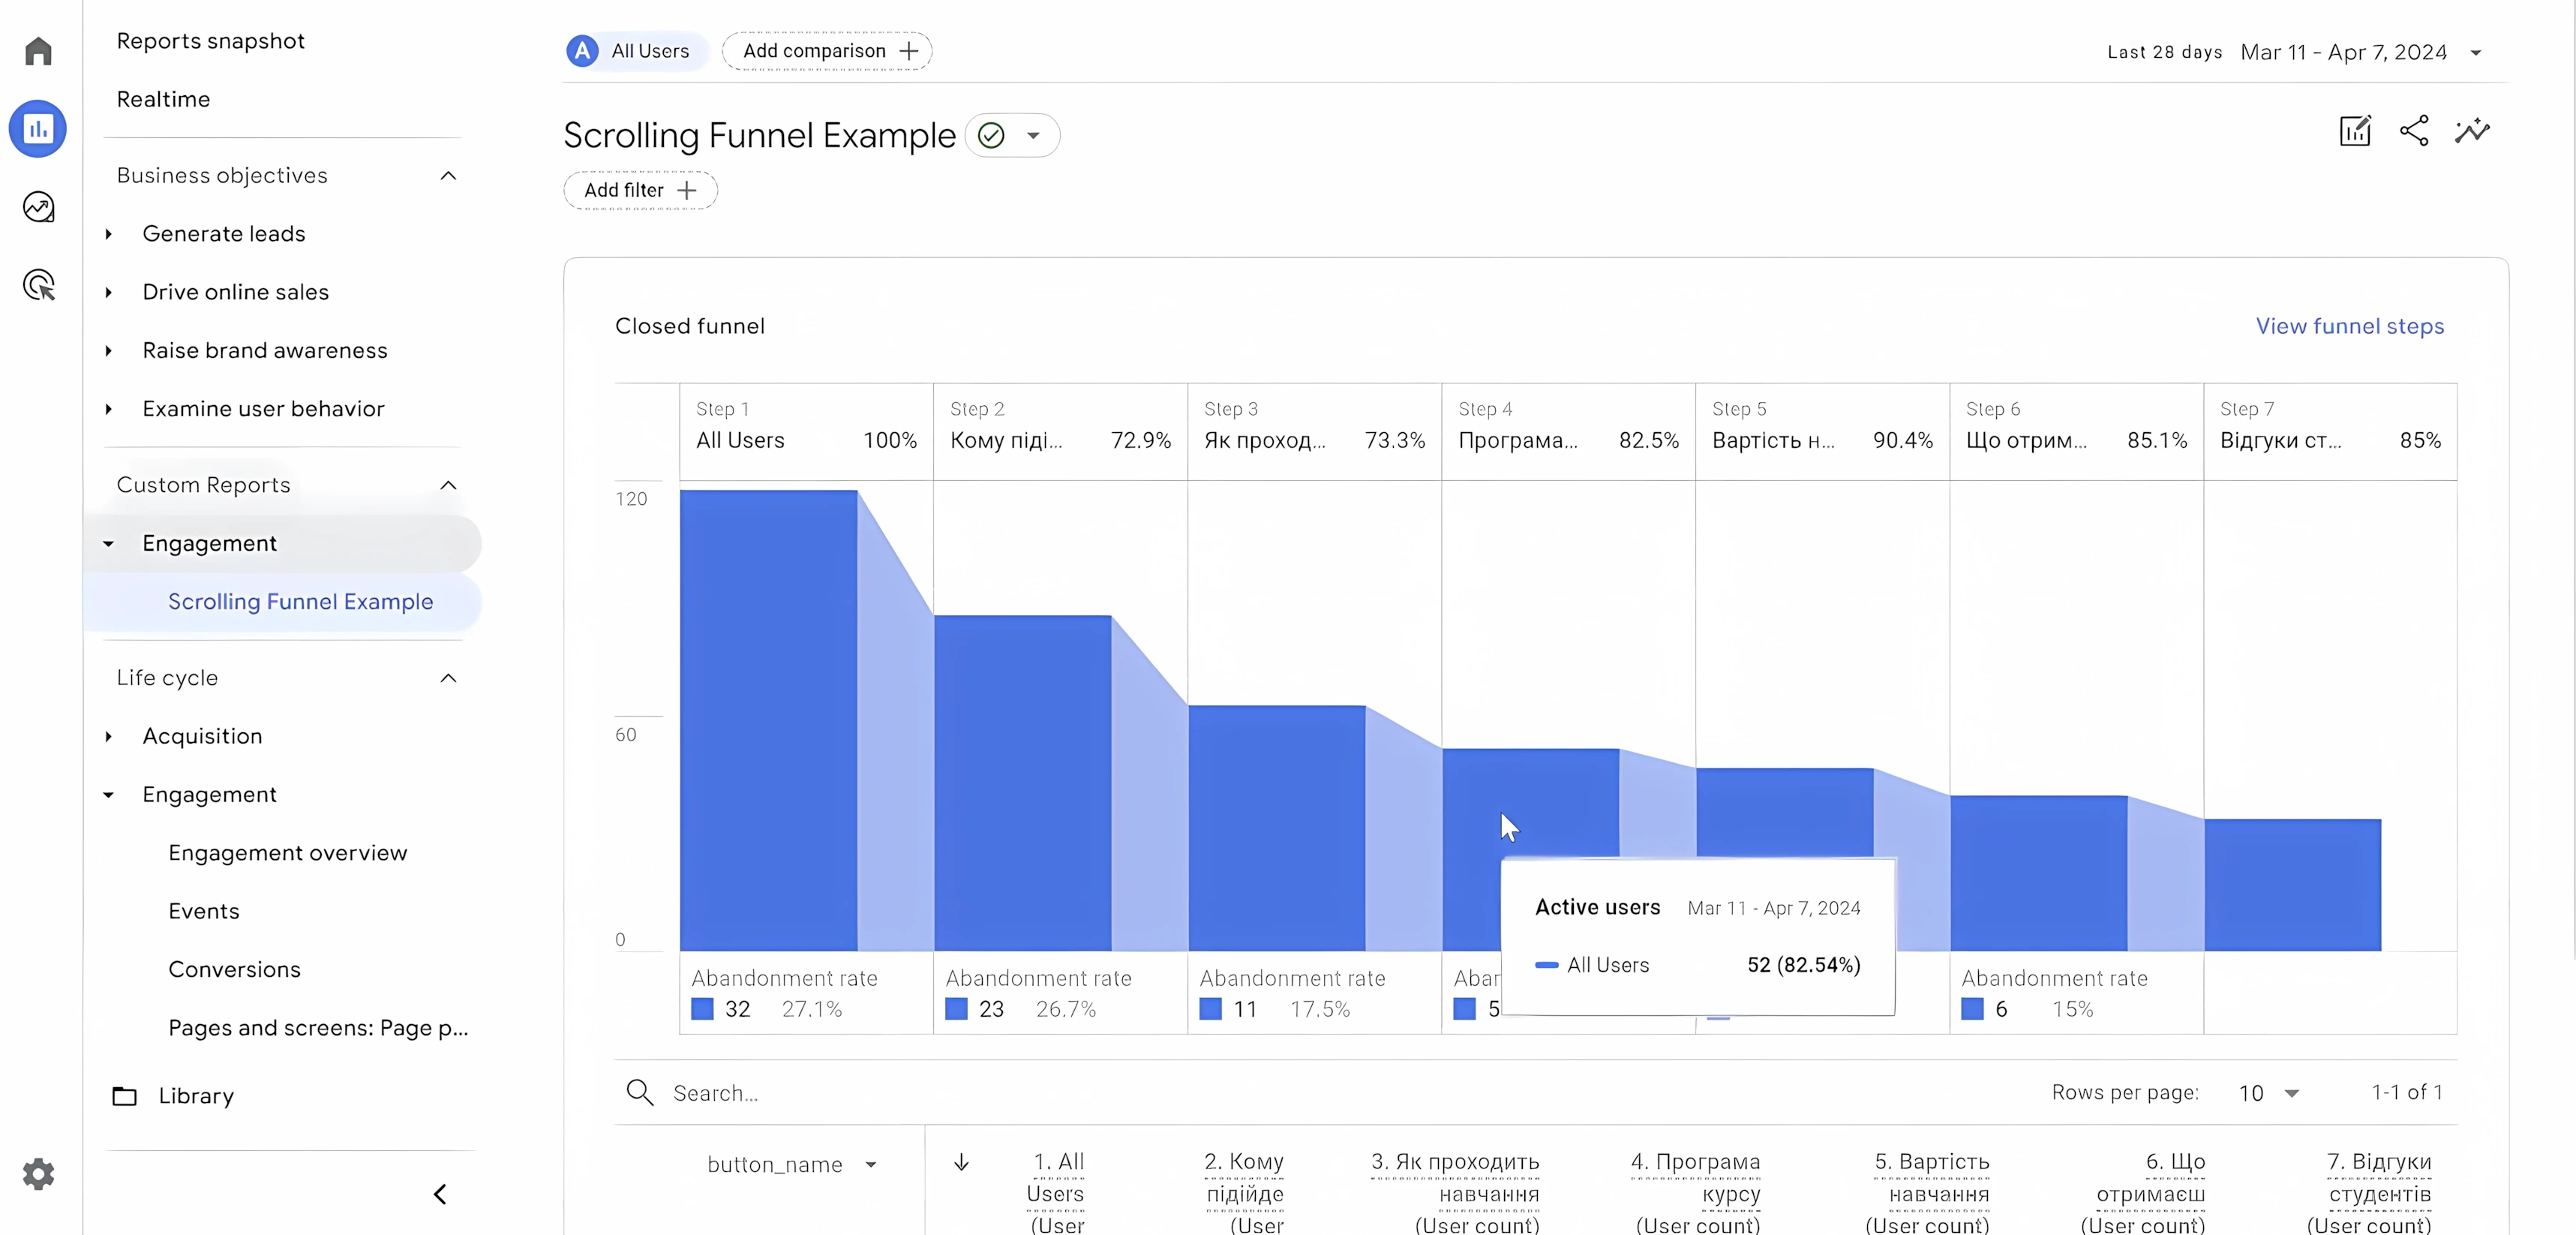
Such a report will show not only the starting position, how many people came to the page, and the last one - how many of them scrolled by 90%. The report will show all the stages that users have passed and at which they have fallen off.
How to build funnels in GA4 can be read in a separate article - Analysis of sequences in Google Analytics 4: Advanced instructions for funnels.
At the same time, do not forget that one user can scroll 90% of the site page in 5 minutes, viewing all the site elements in detail, and another can reach the end of the page in 5 seconds. The involvement of such users will, of course, be different. Therefore, I highly recommend that when analyzing, along with scrolling, you should immediately take into account the time the user spent on the page. One of the options for how to do this can be read here - Tracking the scrolling depth and time on the active tab using Google Tag Manager
If you want to learn more about working with Google Analytics 4 - come to the "GA4 Basics" course, where you will be able to learn in detail how to install, configure and work with Google Analytics 4. You will learn how to track various events on the site, configure conversions and audiences, and build custom reports and more. A detailed program and all information on the course is available at this link.
The next article from the series of advanced statistics events - How to correctly analyze clicks on external links in GA4?
Loading comments…