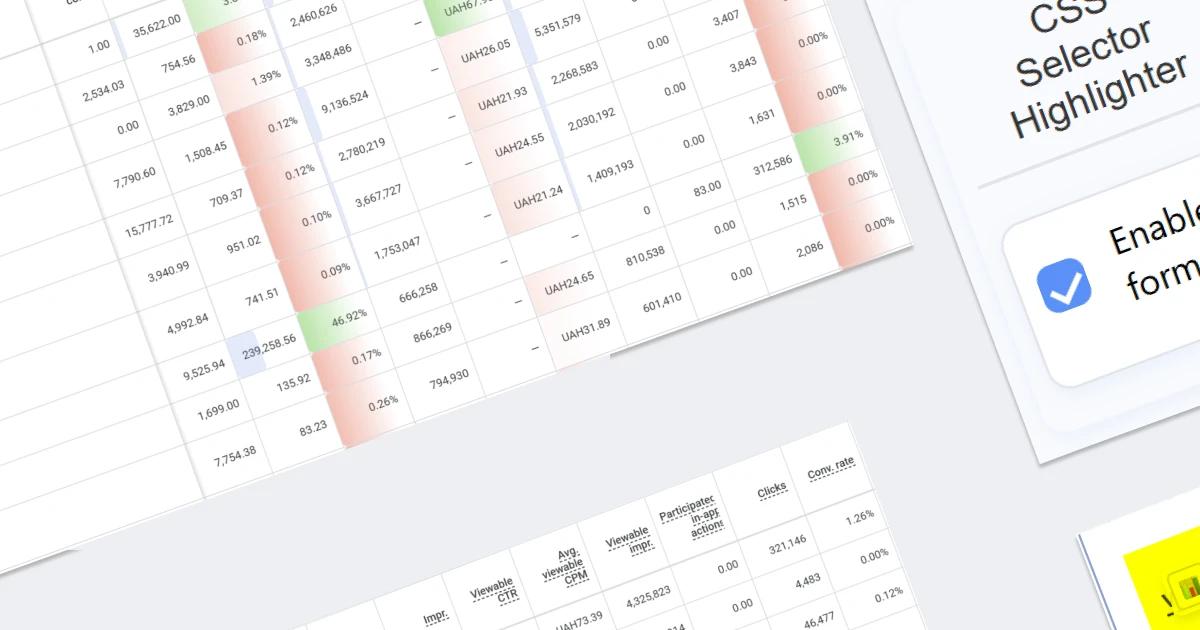

After the PROANALYTICS extension introduced conditional formatting for tables in GA4, many users asked for “something similar” for Google Ads. And now this functionality has arrived.
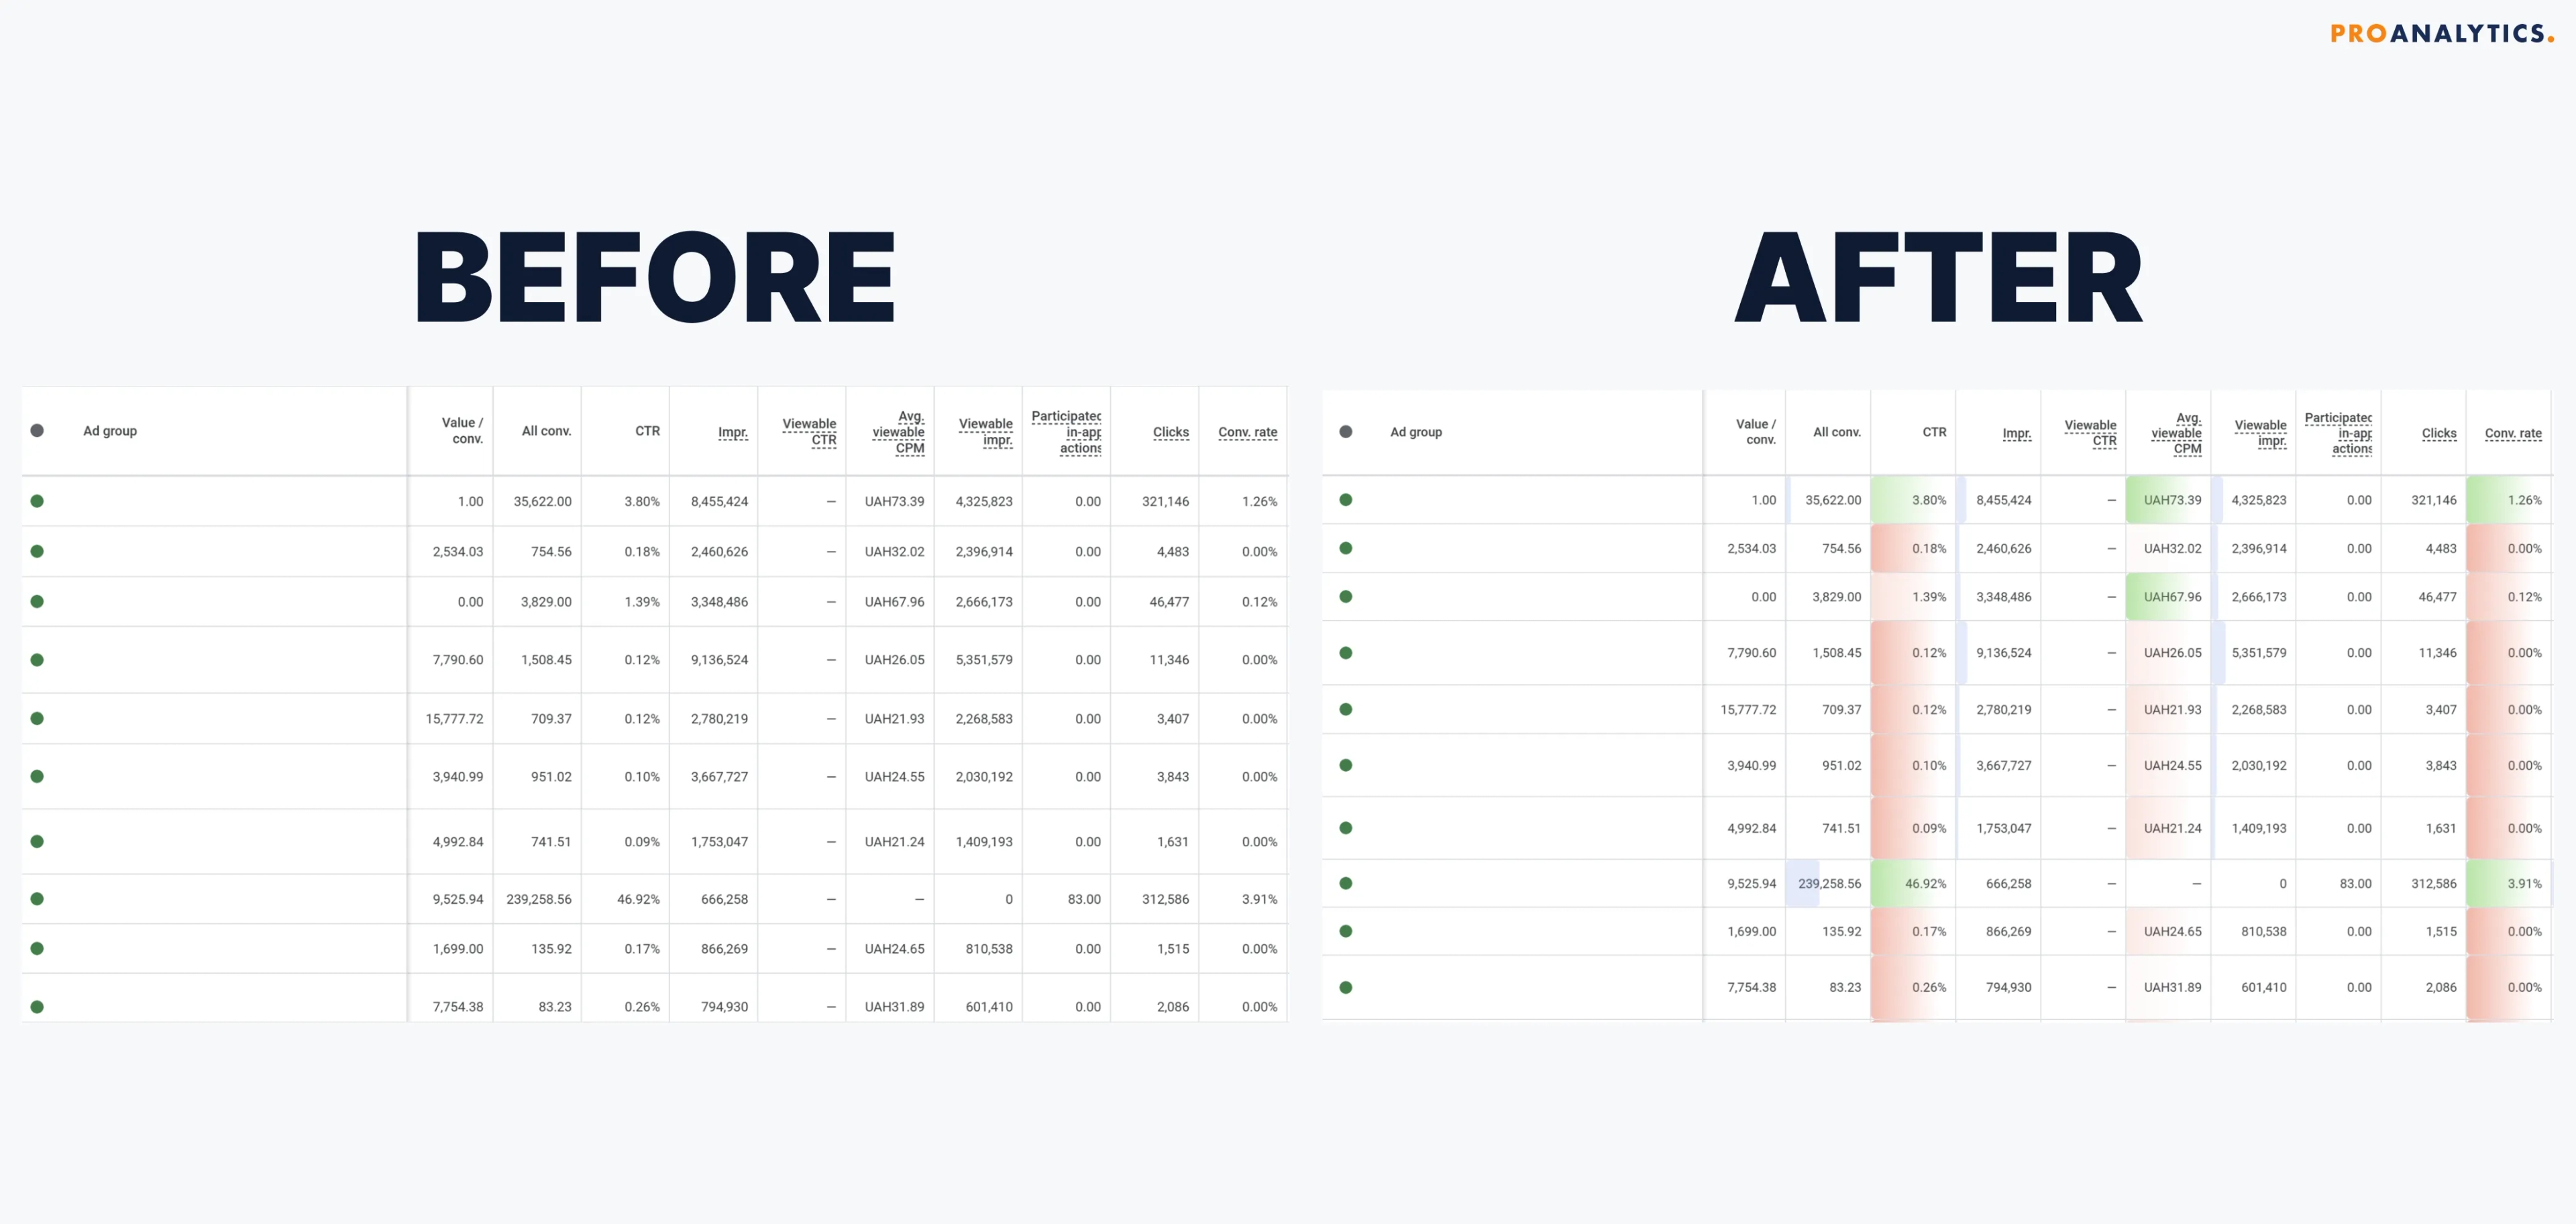
Here is what it looks like in practice:
You can read more about conditional formatting here.
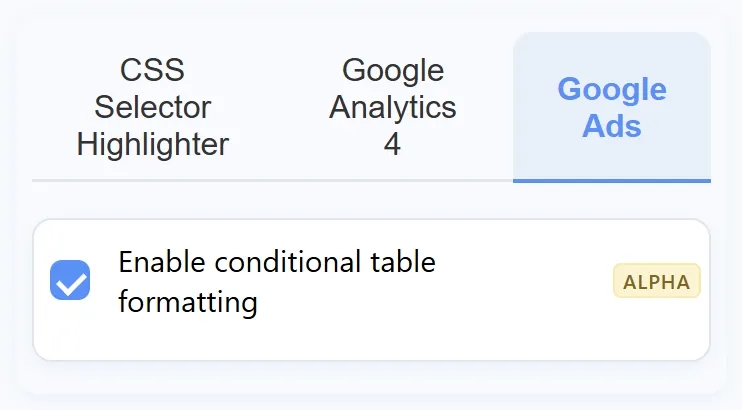
But the Google Ads interface is noticeably more complex from a development perspective on top of the standard functionality: more nuances and usage scenarios. That’s why I’m rolling out this feature gradually — for now, this is an alpha version that you can already test on real projects. If you notice strange behaviour, bugs, or have ideas on how to make the tool more convenient — just write about it in the comments to the post.
Where the new functionality works
In the alpha version, the extension supports only the pages with the main Google Ads data tables:
- Campaigns
- Ad groups
- Ads
- Asset groups
- Keywords
- Search terms
- Locations
- Landing pages
- Advanced bid adjustments
It is on these screens that PROANALYTICS “captures” the table and adds visual cues to it. Leave a comment indicating which other reports you would like to see covered by this functionality.
Logic similar to GA4, but more flexible
The general idea of formatting table data for Google Ads is the same as in GA4: conditional formatting + mini bar charts inside cells, so that key values are visible at a glance without spending time reading through the numbers.
But there is an important nuance: Google Ads has a huge number of metrics, and everyone has their own favourite set. Therefore:
- when you first enable formatting for Google Ads, the table does not change — all cells remain white;
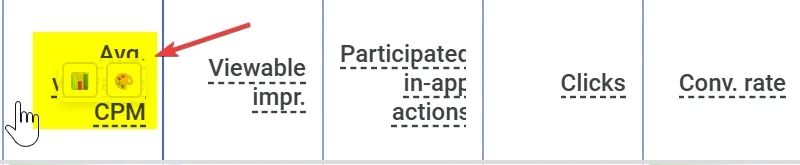
- formatting must be additionally activated at the level of a specific column — you manually choose where highlighting is needed and where it is not. And if it is needed, you choose its type. This helps reduce information noise.
When you hover over a column header, two small icons appear — with their help, you choose what exactly to display for this metric.
This way, you can:
- add bar charts for important “volume-based” metrics (Impressions, Clicks, Conversions),
- apply background highlighting for efficiency metrics (CTR, Conversion rate, ROAS),
- and at the same time leave secondary columns unformatted so they do not distract attention.
Set it once — works everywhere
You don’t need to reconfigure Google Ads columns every time you open the interface: the extension remembers column settings.
For example: if you configure once that Clicks should have a bar chart and Conversion rate should have conditional background formatting, these settings will apply every time these columns appear in a table — whether on the Campaigns page, the Ad groups page, or in the Ads or Keywords lists.
In other words — the configuration is “attached” to the metric itself, not to a specific screen.
Performance
Given the number of possible cells in tables, to ensure everything works quickly, formatting is applied gradually as rows enter the visible area.
This prevents unnecessary browser load. Sometimes, while scrolling, you may notice how columns get coloured “on the fly” — this is expected behaviour for this solution.
Loader during report loading
In some cases, the PROANALYTICS extension adds its own loader on top of the main Google Ads page. Sometimes you may even notice the page scrolling under the loader. This is expected behaviour. It occurs in order to fetch totals or averages needed for calculating bar charts and conditional formatting.
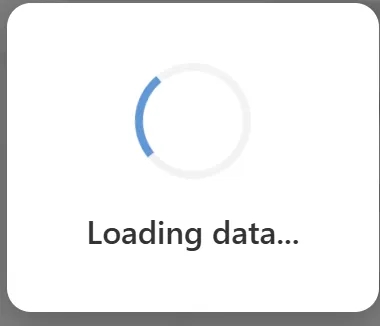
This happens in cases where Google Ads does not load totals or averages immediately. Although this process is usually almost invisible for you, in critical cases with a large amount of data the loader has a 20-second limit. After this time, regardless of whether it completed its function or not, it will disappear, and you will be able to use Google Ads as usual.
In such cases, to see conditional formatting in your table, you will need to manually scroll to the totals.
Feedback
Some extension settings apply only when the page loads. So if you changed the settings — don’t forget to refresh the page.
This is still an alpha version of the Google Ads block, and I’m intentionally releasing it to collect real feedback. If you like the functionality — write to me, it will add motivation to continue improving it. Share ideas about the features you are missing. Report any strange cases or bugs.
It is thanks to such feedback that the PROANALYTICS extension is gradually transforming from a “small helper for PROANALYTICS.ACADEMY students” into a full-fledged working tool for daily analytics for everyone working in internet marketing.
Loading comments…