The Complete Guide to SQL for Google Analytics 4 in BigQuery: Building the Traffic Acquisition Report (Part 2)

In the first part of this guide, we laid the technical foundation for working with "raw" GA4 data in BigQuery: we explored the export structure, learned how to work with nested parameters using scalar subqueries, and built a basic Pages and Screens report. Essentially, we learned how to correctly extract data from the raw export.
But our goal is to move beyond simple data retrieval to creating complex business logic. Today, we will explore how traffic attribution is implemented in BigQuery and why traffic sources exist at different data levels (user, session, event). These are the areas where errors most frequently occur—situations where a query looks correct, but the results are misleading. After that, we will move to practice and build a full Traffic Acquisition report in BigQuery step-by-step.
Section 1. Operators for Raw Data Transformation and Preparation
- 1.1. PARSE_DATE: converting text to date
- 1.2. COALESCE: how to handle NULLs without breaking calculations
- 1.3. CASE WHEN operator
Section 2. Attribution and Traffic Sources
Section 3. Building the Traffic Acquisition report based on session_traffic_source_last_click
- 3.1 Structure of the Traffic Acquisition report
- 3.1.1 Report Dimension: Session source / medium
- 3.1.2 Metric: Sessions
- 3.1.3 Metric: Engaged Sessions
- 3.1.4 Metric: Engagement rate
- 3.1.5 Metric: Average engagement time per session
- 3.1.6 Metric: Events per session
- 3.1.7 Metric: Event count
- 3.1.8 Metric: Key events
- 3.1.9 Metric: Session key event rate
- 3.1.10 Metric: Total revenue
- 3.1.11 Final query: assembling the Traffic Acquisition report in BigQuery
Section 1: Operators for Raw Data Transformation and Preparation
Before building complex reports, we need a toolkit for "cleaning" and transforming data. We already covered basic operators and functions in the first part of the guide, and today we will expand this arsenal.
1.1 PARSE_DATE: converting text to date
The event_date field in the GA4 BigQuery export is stored as a string (STRING) in the format YYYYMMDD (e.g., 20240118). Even though it looks like a date, for SQL, it is plain text. Consequently, you cannot perform typical time-based operations with it — such as calculating the difference between dates, grouping data by weeks or months, or using other standard date functions.
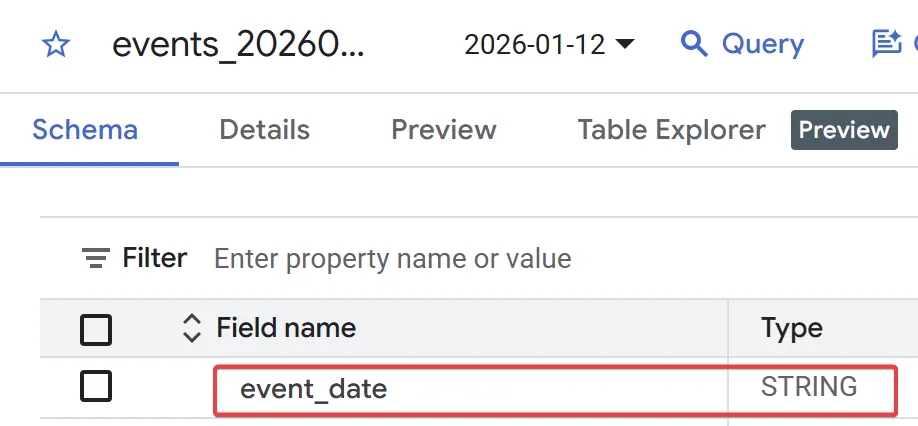
The PARSE_DATE operator allows you to explicitly tell SQL the format in which the date is written and convert the text value into a full DATE type. After this, the value becomes suitable for any time-based calculations.
Basic example of event_date conversion:
SELECT
  event_date,
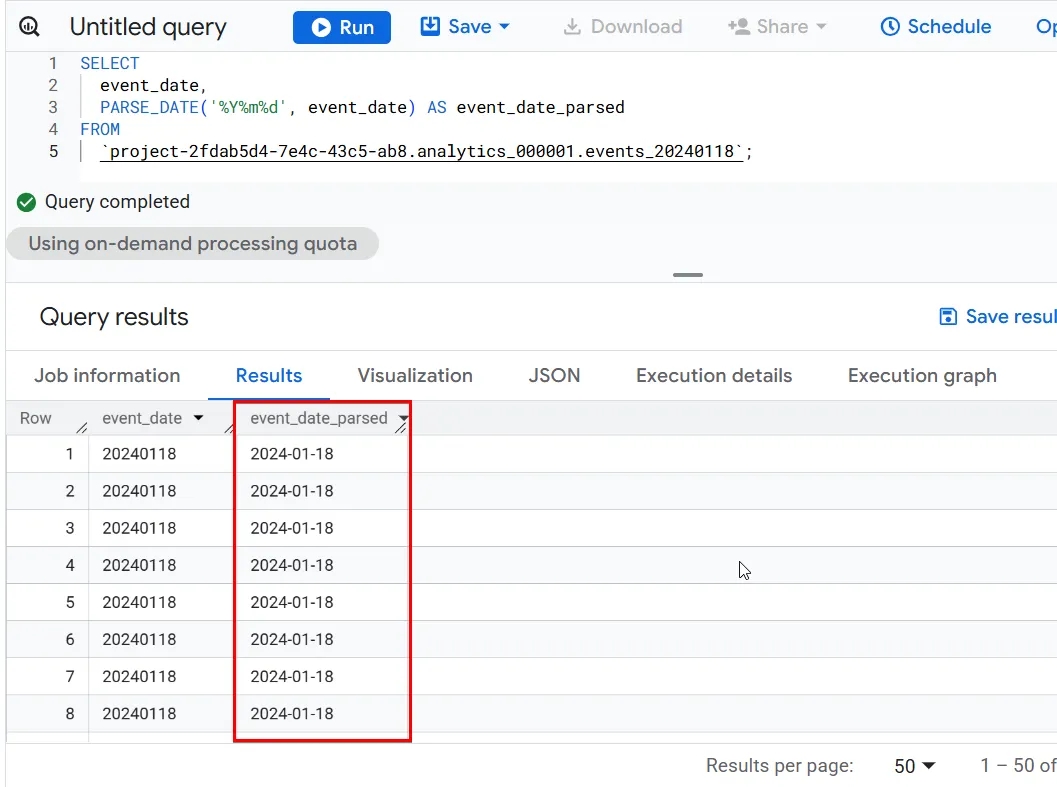
  PARSE_DATE('%Y%m%d', event_date) AS event_date_parsed
FROM
  `project-2fdab5d4-7e4c-43c5-ab8.analytics_000001.events_20240118`;
In this example:
- %Y%m%d describes the string date format (the first four digits represent the year, the next two represent the month, and the final two represent the day. All without delimiters).
- PARSE_DATE converts the text value into a DATE type.
- The new field event_date_parsed can now be used in functions like DATE_DIFF, DATE_TRUNC, or EXTRACT.
Let's look at a practical example using PARSE_DATE for weekly grouping:
SELECT
  DATE_TRUNC(PARSE_DATE('%Y%m%d', event_date), WEEK) AS week_start,
  COUNT(*) AS events_count
FROM
  `project-2fdab5d4-7e4c-43c5-ab8.analytics_000001.events_202401*`
GROUP BY
  1
ORDER BY
  1;
As a result of the query, we get the number of events that occurred during each calendar week within the selected dataset and specified period. For this, all dates are truncated to the start of the week using DATE_TRUNC, and then events are aggregated via COUNT(*).
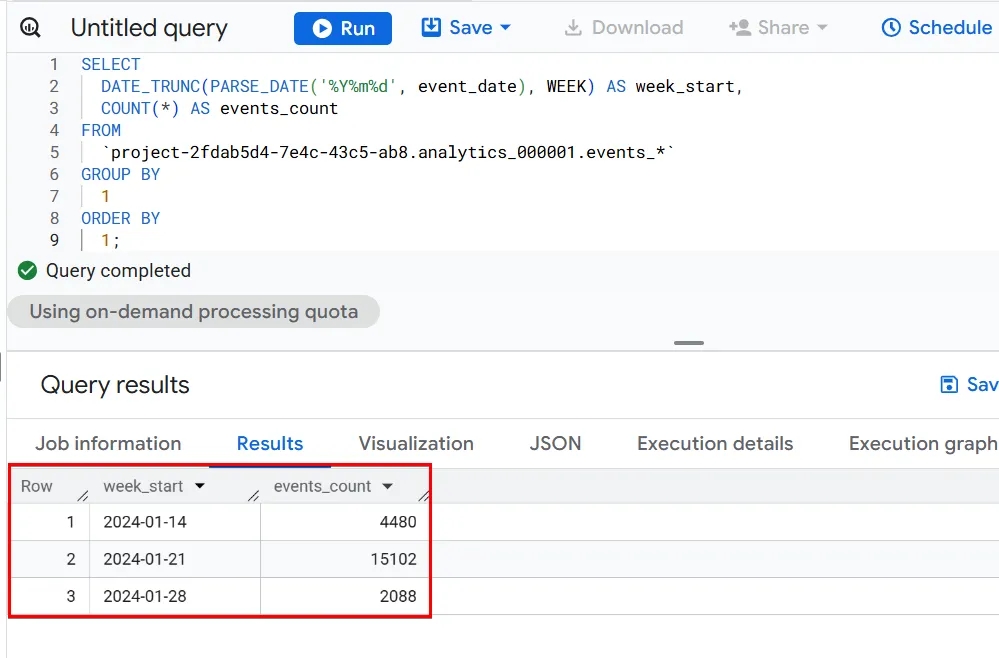
Note: When using the WEEK value in DATE_TRUNC, you will get weeks starting on Sunday. If you need the more standard business option starting on Monday, use ISOWEEK.
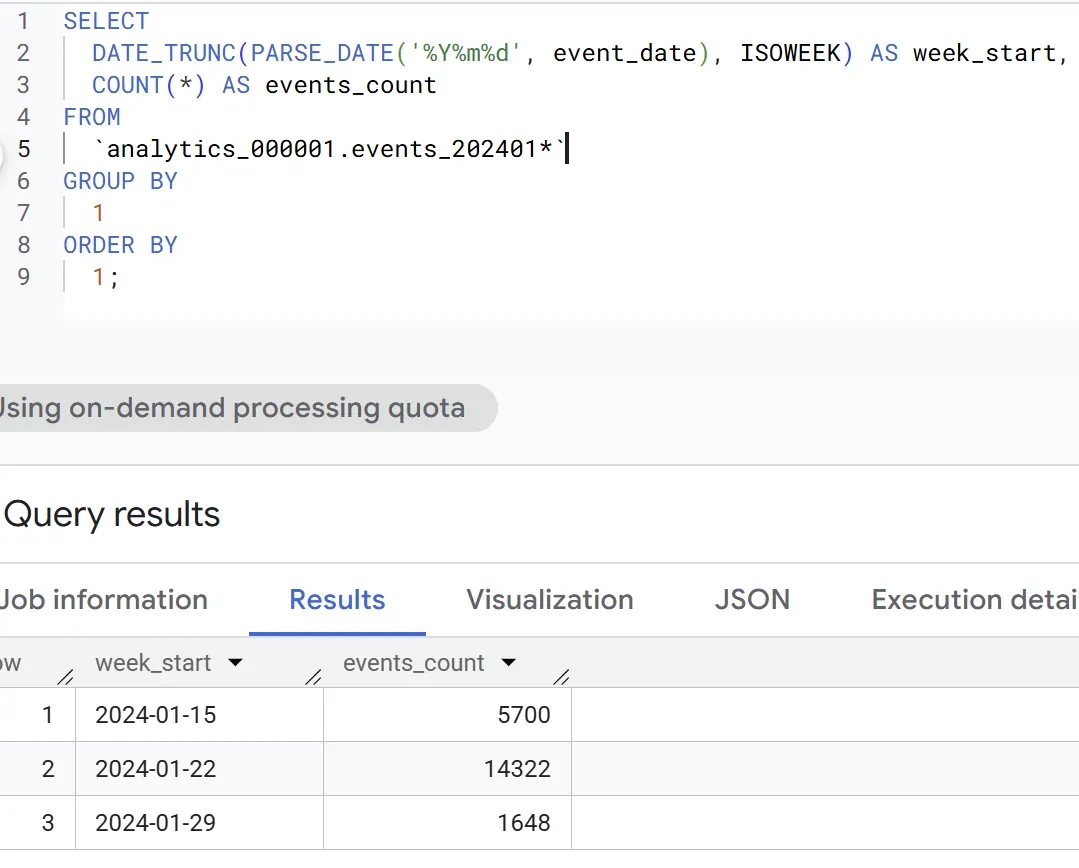
Another common use case for PARSE_DATE is working with _TABLE_SUFFIX for more convenient and accurate data filtering over a specific period. For example, in the query below, we return data from January 15 to January 28, 2024.
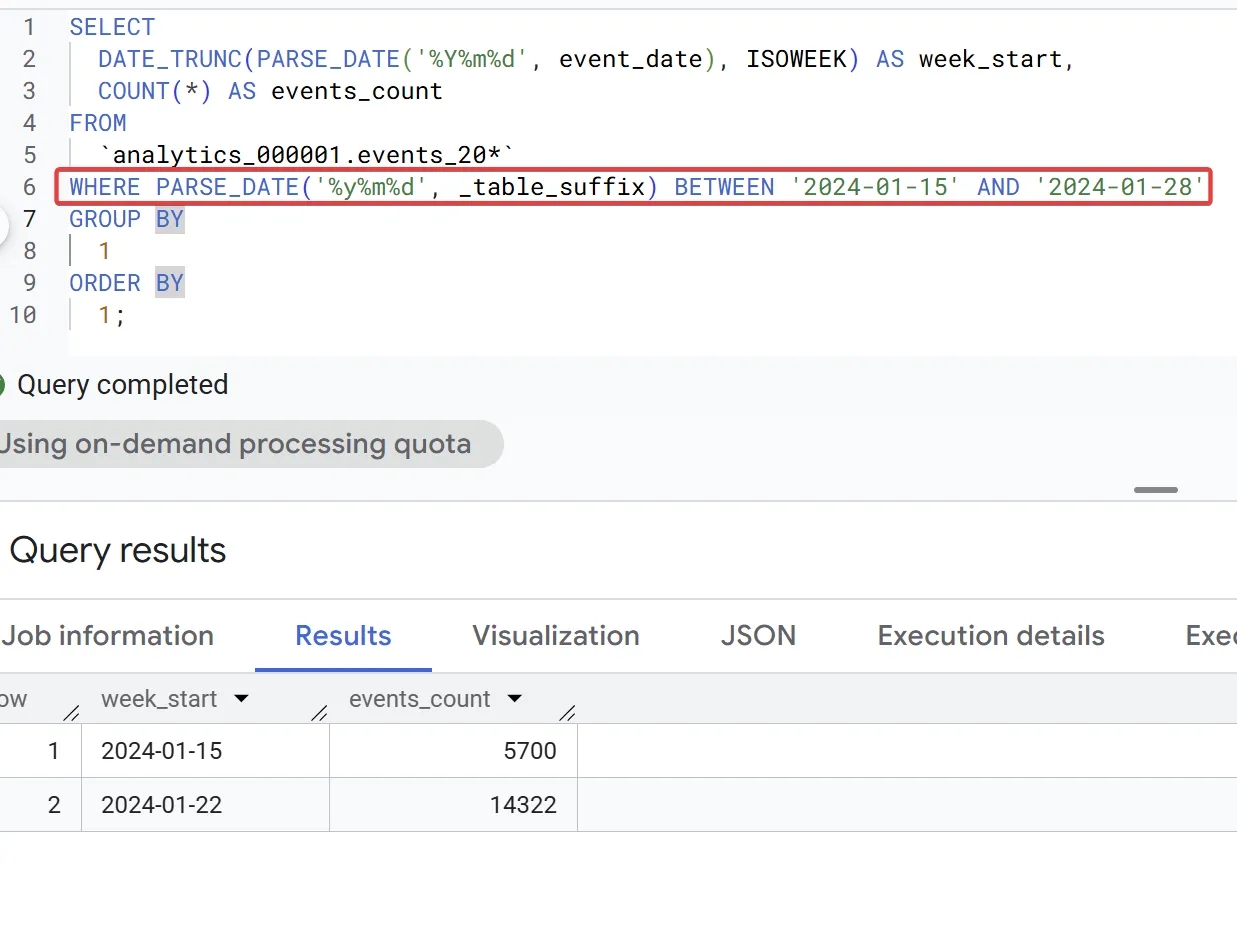
1.2 COALESCE: how to handle NULLs without breaking calculations
In raw GA4 data, NULL is not an exception—it is the norm. It can appear because an event does not always have certain parameters, such as value, transaction_id, etc. This means the field exists in the schema but is not actually populated for a specific event.
The problem is that:
- NULL can break arithmetic calculations;
- Aggregations can return unexpected results;
- Data becomes harder to interpret in reports.
This is exactly why we need COALESCE. COALESCE is an SQL function that returns the first non-NULL value from a list of arguments. Simply put: if a value is missing (NULL), substitute it with another one that we specify. The syntax looks like this:
COALESCE(value_1, value_2, value_3, ...)BigQuery checks arguments from left to right and returns the first one that is not NULL.
Let's break down examples of usage:
Example 1. Protecting numerical calculations from NULL
To simplify the explanation, let's break it down not on GA4 data, but on a simplified example. Imagine a table where three records have values and one record is NULL:
| event_value |
|---|
| 100 |
| 50 |
| NULL |
| 25 |
If you just write:
SELECT SUM(event_value) AS revenueThe result will be 175. BigQuery simply ignores NULL.
And now let's explicitly say that NULL = 0:
SELECT SUM(COALESCE(event_value, 0)) AS revenueThe result will also be 175.
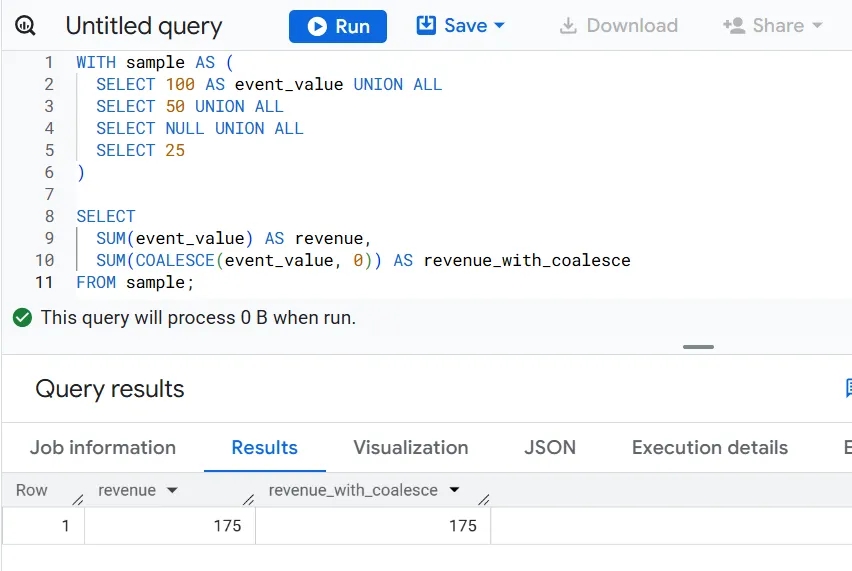
And it might seem that there is no difference. But that's not true. Now let's break down an example with the same data and the AVG function.
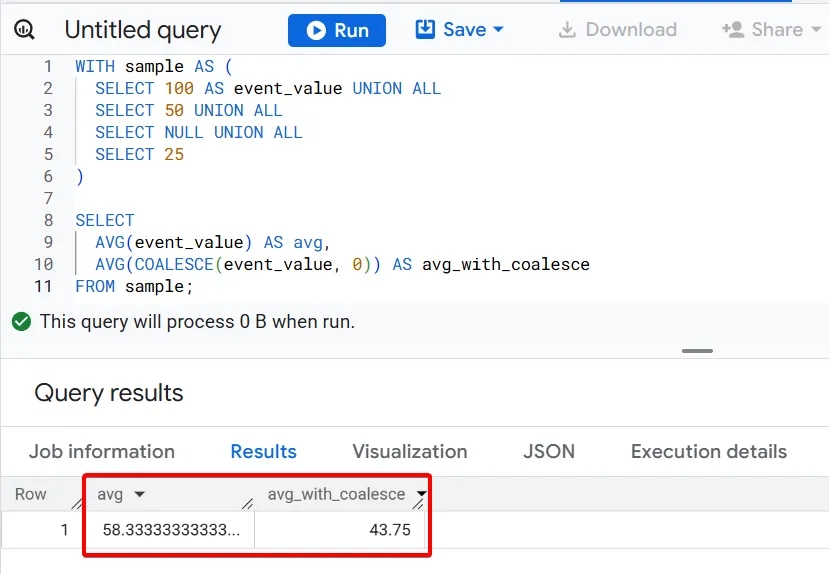
Note. NULL and 0 are different analytical states:
- NULL means that there was no data at all (there is no relevant row).
- 0 means that there were events, but the value is zero or not passed.
To uniquely manage the process, rather than relying on "SQL magic" — do not forget about using COALESCE.
Example 2. Working with text fields
COALESCE is useful not only for numbers. For example, if a traffic source is not defined, we can change NULL to a more understandable (not set):
SELECT
  COALESCE(traffic_source.source, '(not set)') AS source,
  COUNT(DISTINCT user_pseudo_id) AS users
FROM `project-2fdab5d4-7e4c-43c5-ab8.analytics_000001.events_20240118`
GROUP BY source
ORDER BY users DESC;
As a result:
- instead of NULL, there will be a clear value in the report;
- tables and dashboards become more readable.
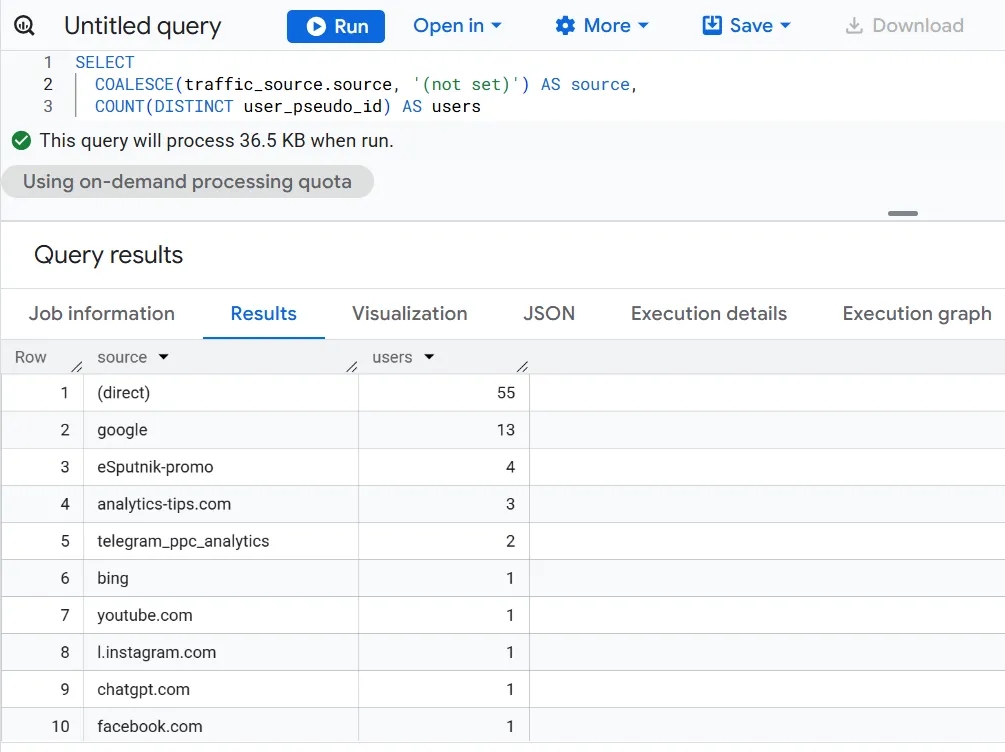
We will talk about another example of using COALESCE in the section Engaged Sessions metric.
1.3 CASE WHEN operator
In BigQuery, the CASE operator is a tool that returns different values depending on the fulfillment of specified conditions. In a simplified form, CASE logic looks like this: "Check if this condition is met. If yes — return the specified value. If no — check the next condition..."
Thanks to this, CASE allows you to:
- create custom categories;
- group content;
- form user segments;
- calculate analytical attributes without changing raw data and without additional tables.
In fact, CASE is a way to add analytical meaning to event data directly in the SELECT statement. The general structure looks like this:
CASE
  WHEN condition1 THEN result1
  WHEN condition2 THEN result2
  WHEN condition3 THEN result3
  ELSE default_result
END
Important:
- BigQuery checks conditions from top to bottom until the first match, so always put the most specific conditions at the beginning.
- Always use ELSE. Without it, all values that did not fall under the conditions will become NULL, which can ruin the final visualization.
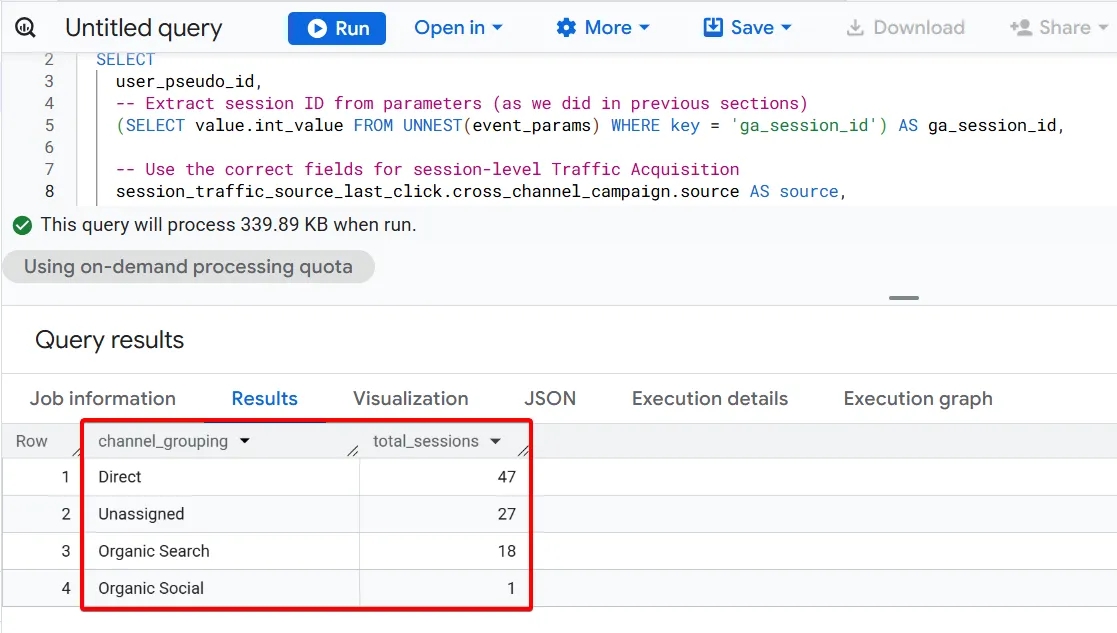
Let's break down a simple example of using this function to create a custom channel group.
Pay attention to the second part, which concerns the use of CASE WHEN. As for the first part with session_traffic_source_last_click.cross_channel_campaign values — we will talk about them a bit later.
WITH session_data AS (
  SELECT
    user_pseudo_id,
    -- Extracting session ID from parameters (as we did in previous parts)
    (SELECT value.int_value FROM UNNEST(event_params) WHERE key = 'ga_session_id') AS ga_session_id,
    -- Referencing the correct fields for session-level Traffic Acquisition
    session_traffic_source_last_click.cross_channel_campaign.source AS source,
    session_traffic_source_last_click.cross_channel_campaign.medium AS medium
  FROM `project-2fdab5d4-7e4c-43c5-ab8.analytics_000001.events_20240118`
  WHERE event_name = 'session_start'
)
SELECT
  CASE
    -- 1. Looking for Direct entries
    WHEN source = '(direct)' OR source IS NULL THEN 'Direct'
    -- 2. Defining paid advertising (PPC)
    WHEN medium IN ('cpc', 'cpm', 'cpv', 'cpa') THEN 'Paid Search/Ads'
    -- 3. Grouping organic from social networks (using regular expressions)
    WHEN REGEXP_CONTAINS(source, r'^(facebook|instagram|linkedin|t\.me)$') OR medium = 'social' THEN 'Organic Social'
    -- 4. Organic search
    WHEN medium = 'organic' THEN 'Organic Search'
    -- 5. Everything else that did not fall under the conditions above
    ELSE 'Unassigned'
  END AS channel_grouping,
  -- Counting unique sessions by combining Client ID and Session ID
  COUNT(DISTINCT CONCAT(user_pseudo_id, '-', ga_session_id)) AS total_sessions
FROM session_data
GROUP BY channel_grouping
ORDER BY total_sessions DESC;
What is happening here:
- CASE creates a new field channel_grouping;
- each WHEN is a separate logical condition;
- END completes the logic and returns a value;
- COUNT(DISTINCT ...) counts sessions in each group;
- GROUP BY aggregates data for each group.
Of course, in reality, more channel groups are usually distinguished; above is just an example of the function's operation, not a full version.
Section 2: Attribution and Traffic Sources
2.1 What is attribution and why is it important?
Attribution and traffic sources are one of the most complex topics in web analytics. One and the same user can come to the site from an ad, return from organic search, then enter directly (Direct) and subscribe to a newsletter, and make a conversion after clicking from an email newsletter. Which source a session or conversion is "credited" to depends on the attribution model and source prioritization rules. Accordingly, attribution determines which channels and campaigns look "effective" in reports and which do not.
In the GA4 interface, most of this logic is hidden from the user because traffic sources, attribution models, and prioritization rules are applied automatically. In BigQuery, it's different: we work with raw data, and therefore we must clearly understand two points:
- which attribution model we are reproducing (because reports can be based on different approaches);
- which specific value in the GA4 export to BigQuery corresponds to which data level.
We will start with the second one.
2.2 Three levels of traffic data
One of the key reasons for confusion when working with GA4 data in BigQuery is ignoring the fact that traffic sources exist at different levels (scopes). As in the GA4 interface, there is no single "correct" source / medium field — instead, there are several levels of data, each of which answers its own analytical question.
In BigQuery, these levels are implemented at the level of the data structure, and they are fundamentally not interchangeable. If you use a field "from the wrong level," the query might look logical and return neat figures, but the interpretation of such data will be false.
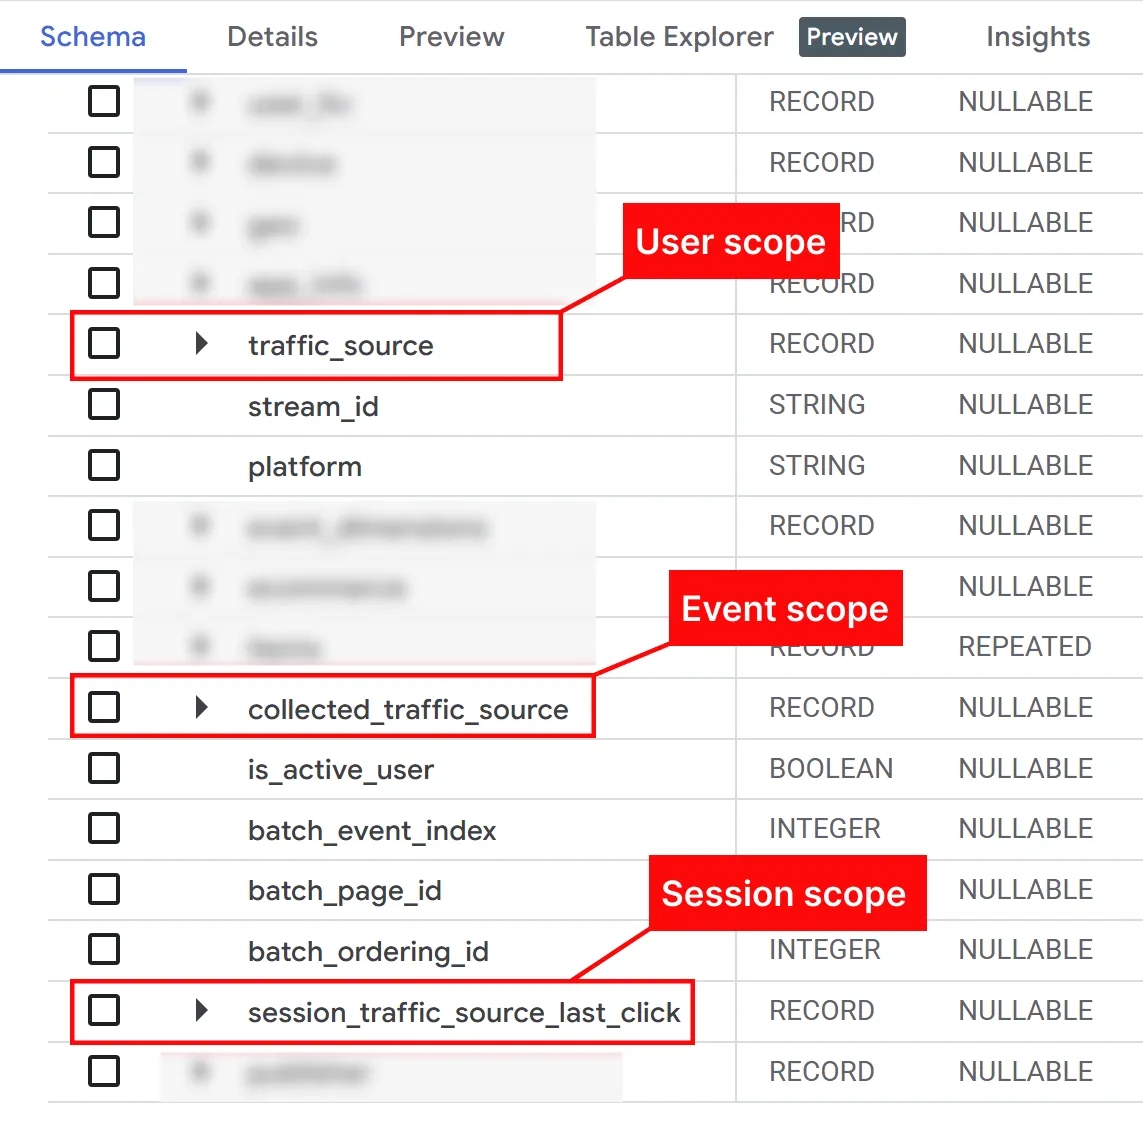
In the context of traffic analysis in the GA4 export data to BigQuery, it is worth clearly distinguishing three levels (they are similar to those in the interface):
- user level (User),
- session level (Session),
- event level (Event).
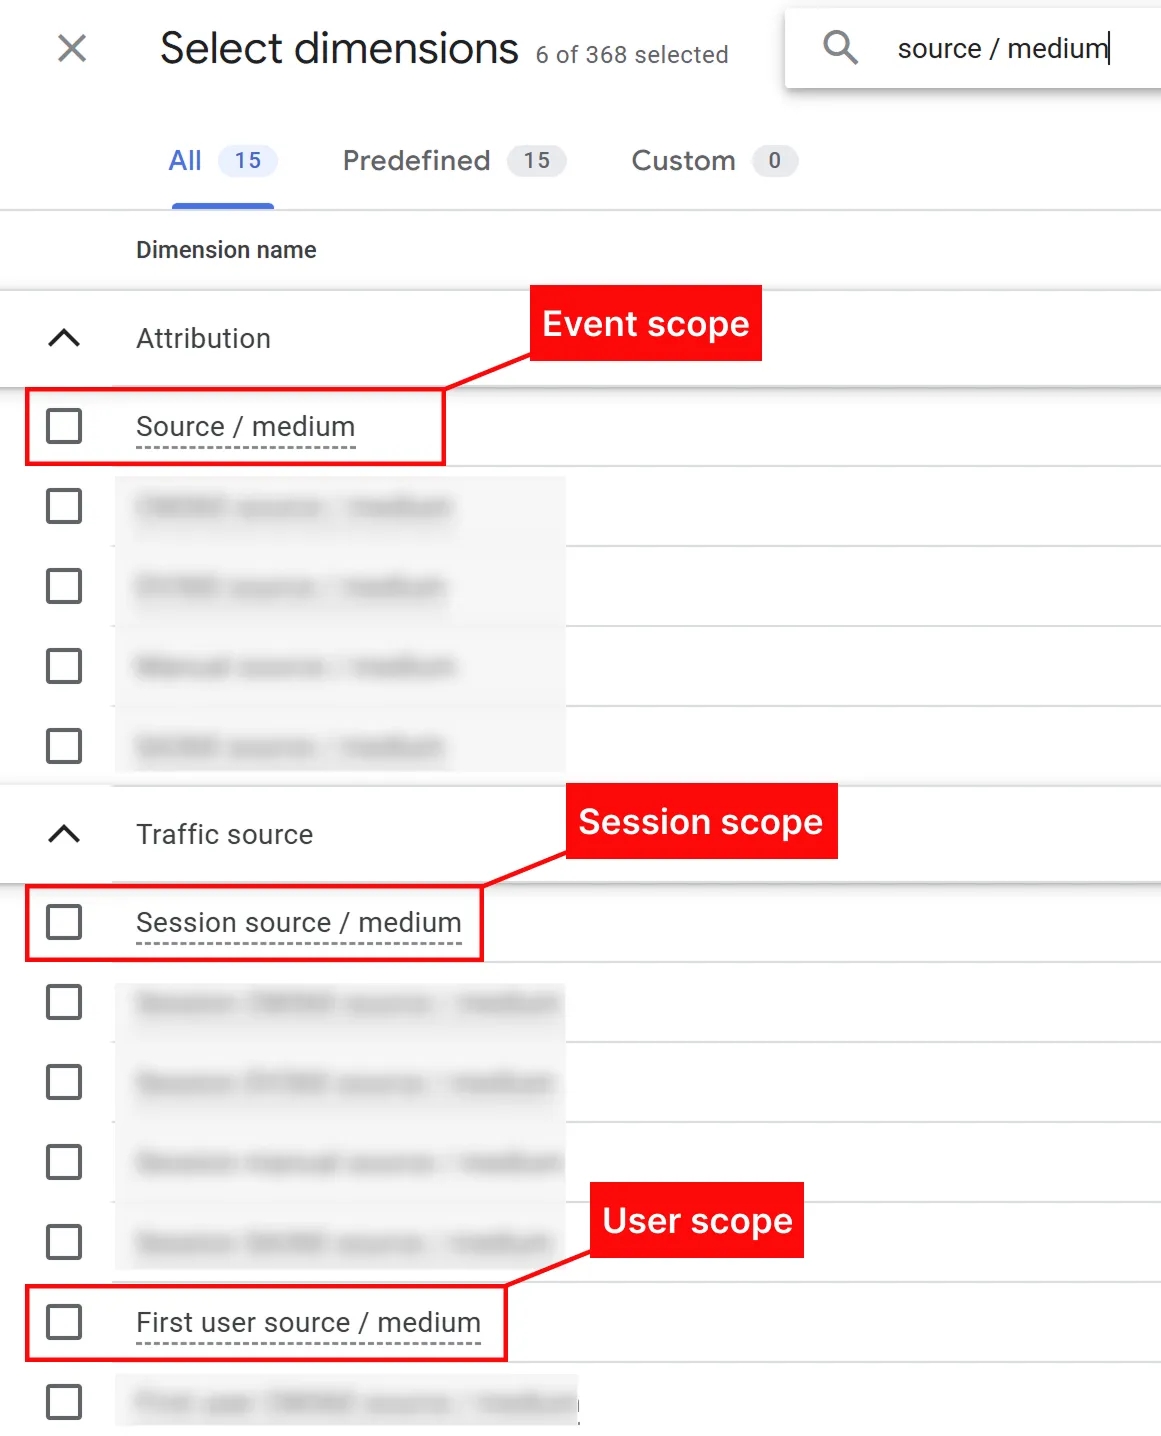
How GA4 level logic translates into BigQuery
As we already know, the GA4 export in BigQuery has an event structure: one row of the table corresponds to one event. However, this does not mean that all data in this row has the same analytical meaning. On the contrary — inside each "event" row, information is stored that logically belongs to different levels of entities: user, session, and event.
- User-level (User level) — you analyze the user as a separate entity. The basic unit of such analysis is
user_pseudo_id, which identifies the user throughout their interaction with the site or app. From the perspective of the traffic source, here we are talking about the source that first acquired the user to our site. - Session-level (Session level) — you analyze individual user visits. One user can have many sessions and you already know that each session is defined by the combination of
user_pseudo_idandga_session_id. When we talk about sources at this level, we usually mean the traffic source from which the session started. - Event-level (Event level) — you work with specific user actions within a session. Here, each row of the table is a separate event with its own name (
event_name) and execution time (event_timestamp), and the additional context of the event is passed through parameters. From the point of view of traffic sources, this is the "raw level." We have information about every event and we can do whatever we want with it; in other words, it is precisely on data from this level that we can build our own attribution models.
Thus, although at first glance the export in BigQuery has an event logic, an analyst always works not with "event rows," but with a hierarchy of entities: user → session → event. The level at which you aggregate data directly determines the meaning of metrics and the correctness of conclusions. And an incorrect understanding of the level you have to work with/are working with leads to incorrect calculations and false conclusions.
Understanding this logic becomes critically important when we move to the analysis of traffic sources. Therefore, below I have prepared a table that will help you once and for all figure out and remember which level each of the traffic source fields belongs to and what analytical question it is intended to solve.
Traffic source fields in BigQuery: traffic_source, session_traffic_source_last_click, collected_traffic_source
| Scope | Field in BigQuery | Field in GA4 Interface | Description and Logic | When to Use |
|---|---|---|---|---|
User | traffic_source (e.g., traffic_source.source, traffic_source.medium, traffic_source.name) | First User (e.g., First user source, First user medium, First user source / medium, First user campaign) | This is the source that brought the user to the site for the first time. It is recorded once and does not change during the entire life of the cookie. | Used for analysis of new user acquisition. User Acquisition report in the interface. |
Session | Session_traffic_source_last_click.cross_channel_campaign (e.g., session_traffic_source_last_click.source, session_traffic_source_last_click.medium, session_traffic_source_last_click.campaign, session_traffic_source_last_click.cross_channel_campaign) | Session (e.g., Session source / medium, Session medium, Session source, Session source platform, Session campaign) | Attributed session source, determined by Last Non-Direct Click logic. Last Non-Direct Click means that the last Direct will be replaced by the last known non-Direct source. I.e., if a user came from Organic and then returned Direct — the session will be credited as Organic. | Used for traffic analysis. Corresponds to the Traffic Acquisition report in the interface. |
Event | collected_traffic_source (e.g., collected_traffic_source.source, collected_traffic_source.medium, collected_traffic_source.campaign, collected_traffic_source.source_platform) | For example, Source, Medium, Source / medium, Campaign, Source platform, Google Ads campaign | This is "raw" data about the source of a specific event. These data do not pass through any attribution logic and can change even within a single session. | Used for analyzing all touchpoints and building custom attribution models. In the interface, data from this level is used to build reports within the Advertising section. |
And to finally reinforce the material, let's break down an example to see the difference. Imagine such a user:
- The user first enters the site from Google organic search (
google / organic) and, for example, subscribes to a newsletter. - A few days later, he goes to the site from an email newsletter (
esputnik / email). - Later, he opens the site directly by entering the URL in the browser (
direct / (none)), and during this visit makes a purchase.
In this scenario, depending on the data level we use in BigQuery, the information will be as follows:
traffic_source(User-level) For this user, the traffic source will always begoogle / organic, since it was from this channel that he got to the site for the first time. Even a purchase made during a direct visit will be associated withgoogle / organicat the user-level. That is why this field is suitable for analyzing the acquisition of new users, but not for evaluating campaign effectiveness.session_traffic_source_last_click(Session-level) The session within which the purchase took place will be attributed toesputnik / email(this was the last non-direct channel). This field reproduces the logic of the standard Traffic Acquisition report in GA4 and is suitable for analyzing traffic effectiveness and conversions at the session level.
Important nuance. Inside session_traffic_source_last_click, you will see a lot of different information. The closest to the classic interface value of sources at the session level will be stored in cross_channel_campaign.
collected_traffic_source(Event-level) At the event level, raw data will be waiting for you. By themselves, without additional processing, they are not very useful. But it is precisely based on these data that you can build your own attribution logic. For example, using Linear non-direct attribution (linear attribution without taking direct into account), we can assign 50% of the purchase value togoogle / organic, and the other 50% toesputnik / email.
Details about the structure of these and other fields in BigQuery can be found in the official documentation.
Section 3: Building the Traffic Acquisition report on session_traffic_source_last_click
Before we move to practice, it is important to note: these data are not 100% identical to those you see in the GA4 interface. Our team conducted research on 15 projects and found that data match in less than half of the cases. Usually, BigQuery records less google / cpc traffic than the interface. More about this research you can read in the article "Comparing traffic sources between GA4 and session_traffic_source_last_click in BigQuery".
Despite these discrepancies, and especially considering that they were noticed not on all projects, the use of session_traffic_source_last_click fields is the best start for getting acquainted with attribution in BigQuery. Especially if you consider that officially Google positions them as an analog to data from the Traffic Acquisition report, which is exactly what we need.
3.1 Structure of the Traffic Acquisition report
Here we are getting to the most interesting and practical part. But to start writing an SQL query, you need to understand very well exactly what the Google team outputs in this report. The Traffic Acquisition report analyzes traffic effectiveness precisely at the level of sessions, not individual events or users. That is why it is based on such principles:
- key entity — session;
- traffic source is determined for the session;
- all metrics are aggregated around sessions.
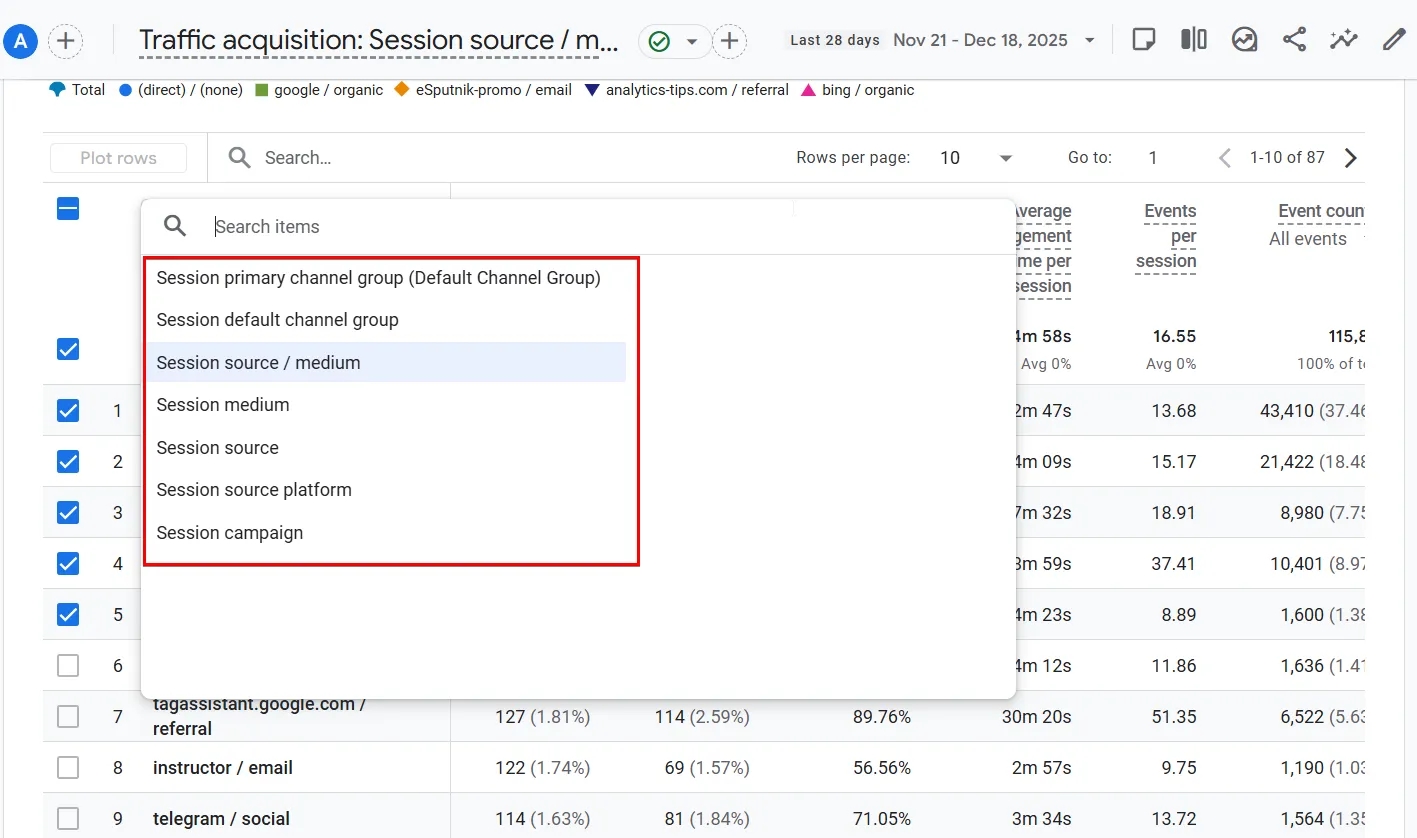
Dimensions:
- Session primary channel group - the main channel group of the session, which shows the main way users come to the site or app.
- Session default channel group - the standard channel group of the session, which defines the main channels through which users come to the site (for example, organic search, direct interaction, referrals, etc.).
- Session source / medium - the combination of the source and channel of traffic that brought users to the site or app.
- Session medium - the traffic channel (for example, organic search, paid search).
- Session source - the traffic source (for example, google, facebook).
- Session source platform - the platform of the traffic source through which users came to the site or app.
- Session campaign - the traffic source campaign through which users came to the site or app.
Metrics:
- Sessions - the number of sessions that started from a certain source, channel, or campaign.
- Engaged sessions - the number of sessions in which users actively interacted with the content.
- Engagement rate - the percentage of engaged sessions of the total number of sessions.
- Average engagement time per session - the average interaction time per session.
- Events per session - the number of events per session.
- Event count - the total number of events.
- Key events - key events that took place on the site.
- Session key event rate - the percentage of sessions in which key events occurred of the total number of sessions.
- Total revenue - total revenue obtained from users who came through a certain source, channel, or campaign.
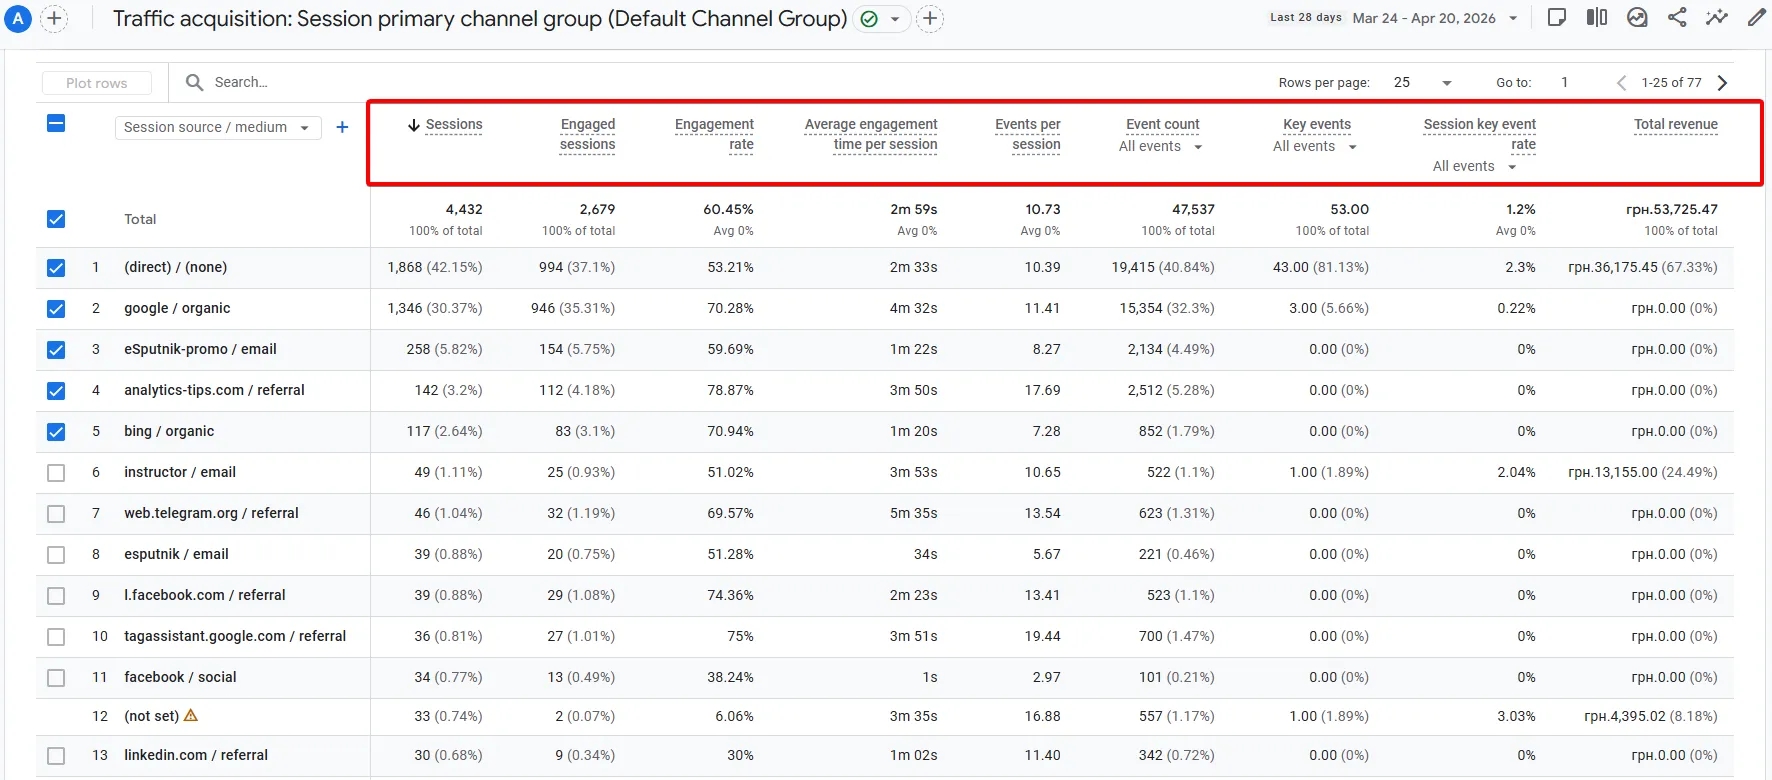
Next, we will step-by-step recreate each column of this report and break down their nuances, and at the end, we will merge everything into a final SQL query.
3.1.1 Report Dimension: Session source / medium
The most frequently used parameter in the Traffic Acquisition report is Session source / medium, so we will start our report with it. For this, we will use session_traffic_source_last_click.cross_channel_campaign. This is a part of the session_traffic_source_last_click object, which contains the attributed source of the session.
SELECT
  CONCAT(
    session_traffic_source_last_click.cross_channel_campaign.source,
    ' / ',
    session_traffic_source_last_click.cross_channel_campaign.medium
  ) AS session_source_medium
FROM `project_id.analytics_xxxxx.events_*`
WHERE _TABLE_SUFFIX BETWEEN '20251101' AND '20251130'
GROUP BY 1;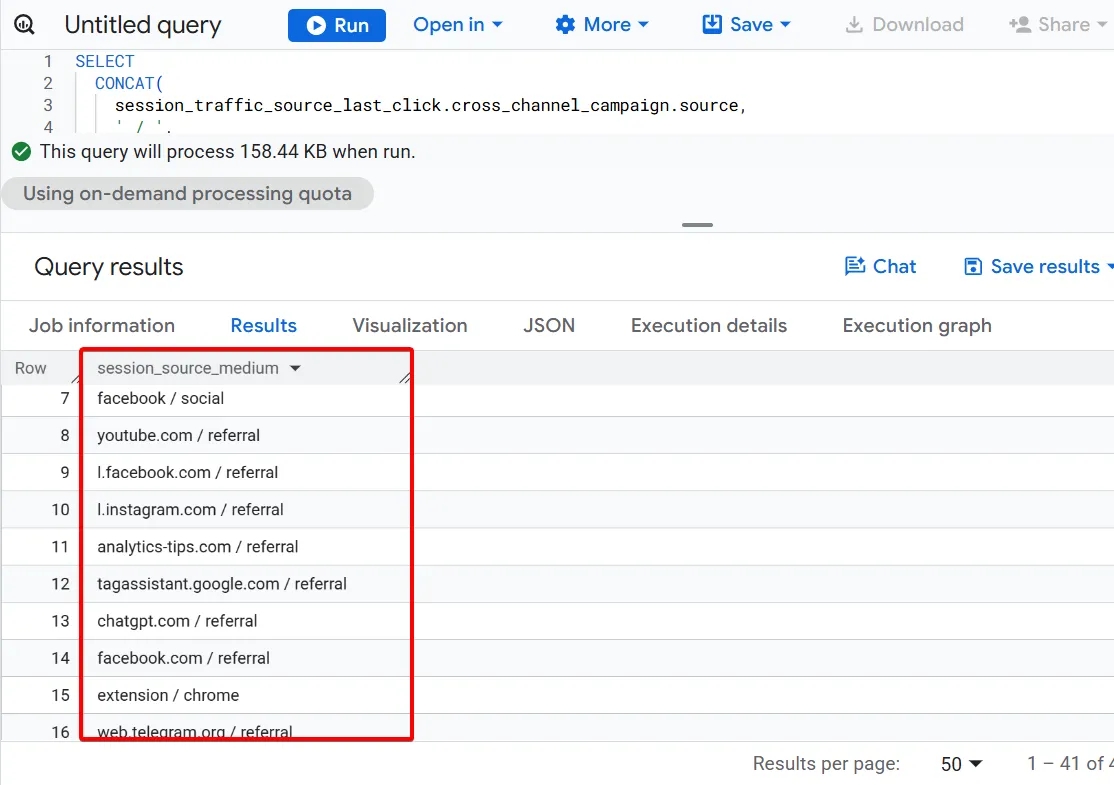
3.1.2 Sessions Metric
We already defined it above. Let me remind you that in BigQuery we define a session as a unique combination of user_pseudo_id and ga_session_id:
COUNT(
  DISTINCT CONCAT(
    user_pseudo_id,
    '-',
      (SELECT ep.value.int_value FROM UNNEST(event_params) AS ep WHERE ep.key = 'ga_session_id')
  )
) AS sessions
3.1.3 Engaged Sessions Metric
Engaged Sessions — here it gets more interesting. According to the official GA4 logic, a session is considered "engaged" if at least one of the conditions is met:
- the session lasted more than 10 seconds, or
- contained a key event (conversion), or
- had 2 or more page/screen views.
At the same time, in the GA4 settings themselves, the number of seconds for the condition "session lasted more than 10 seconds" can be changed.
But don't worry, you won't have to take all these conditions into account in the SQL query yourself. In the GA4 export, there is a special parameter session_engaged, which marks sessions that meet these criteria.
The session_engaged parameter can have the following values:
- "1" — the session meets the rules of an engaged session;
- "0" or NULL — the session does NOT meet the rules of an engaged session.
Let's break it down more practically:
Don't forget that the session_engaged parameter, as well as ga_session_id, is stored in the nested array event_params. For BigQuery to see them, you first need to unpack these parameters using the UNNEST operator, which we already analyzed in detail in the previous part of the guide.
If you don't go into details and nuances, the query for obtaining sessions with interaction would look something like this: we simply count unique real_session_id where the value of session_engaged equals 1. And although the query below returns a certain result — in most cases, it will be incorrect.
SELECT
  COUNT(
    DISTINCT IF(
      (SELECT ep.value.string_value FROM UNNEST(event_params) AS ep WHERE ep.key = 'session_engaged') = '1',
      CONCAT(
        user_pseudo_id,
        '-',
        (SELECT ep.value.int_value FROM UNNEST(event_params) AS ep WHERE ep.key = 'ga_session_id')
      ),
      NULL
    )
  ) AS engaged_sessions
FROM `project_id.analytics_xxxxx.events_*`
The reason for the error is that there are nuances in GA4 export data. One of which is that whole numeric values can be recorded in both event_params.value.string_value and event_params.value.int_value.
Therefore, a correct query must take this feature into account. For comparison, below you can see the results of the "first" solution and the correct one:

As seen in the screenshot above, the difference in this specific case was 1 − (3633 / 4372) ≈ 17%, which is quite significant.
SELECT
  -- Option 1: "Naive" approach (checks only string_value)
  -- Might miss sessions where the value is recorded as a number
  COUNT(
    DISTINCT IF(
      (SELECT ep.value.string_value FROM UNNEST(event_params) AS ep WHERE ep.key = 'session_engaged') = '1',
      CONCAT(
        user_pseudo_id,
        '-',
        (SELECT ep.value.int_value FROM UNNEST(event_params) AS ep WHERE ep.key = 'ga_session_id')
      ),
      NULL
    )
  ) AS engaged_sessions_strict,

  -- Option 2: Safe approach with COALESCE
  -- Checks both string_value and int_value, bringing them to a common type (STRING)
  COUNT(
    DISTINCT IF(
      (SELECT COALESCE(ep.value.string_value, CAST(ep.value.int_value AS STRING)) FROM UNNEST(event_params) AS ep WHERE ep.key = 'session_engaged') = '1',
      CONCAT(
        user_pseudo_id,
        '-',
        (SELECT ep.value.int_value FROM UNNEST(event_params) AS ep WHERE ep.key = 'ga_session_id')
      ),
      NULL
    )
  ) AS engaged_sessions_safe
FROM `project_id.analytics_xxxxx.events_*`
WHERE _TABLE_SUFFIX BETWEEN '20251101' AND '20251130'
Explanation of query nuances:
- UNNEST(event_params) is used to access the session_engaged parameter since it is stored in a nested array.
- COALESCE + CAST is our protection against "dirty" data. We check the text field string_value. If it is empty, we take the numeric int_value, safely convert it to text using CAST and pass it on. This guarantees that we will find our "one," however GA4 might have recorded it.
- IF forms a conditional value of real_session_id:
- If after all checks session_engaged equals '1' (i.e., the session meets the criteria of "engaged"), we return the unique session identifier.
- If the session is not engaged, the expression returns NULL.
- CONCAT forms this same unique identifier. It combines user_pseudo_id and ga_session_id. Thanks to the mechanism of implicit coercion, BigQuery itself understands that the numeric session ID value needs to be converted to text for concatenating.
- COUNT(DISTINCT…) counts only unique identifiers of engaged sessions. This is critically important because one session contains many events (
page_view,scroll,user_engagement), and if we did not use DISTINCT, we would simply count the number of events instead of the number of sessions. And the NULL value (unengaged sessions) is simply ignored by the COUNT function.
Phew.. This was one of the hardest for today. It will be easier from here on.
3.1.4 Engagement rate Metric
Engagement rate is the share of engaged sessions of the total number of sessions. To calculate it, we need to divide engaged_sessions by sessions. We already have both of these values, so theoretically we could simply use the "/" symbol, but we are learning to write correct and safe code right away, so we will do it using SAFE_DIVIDE.
This function performs the division of two values and prevents a division by zero error. The calculation will look like this:
SAFE_DIVIDE(engaged_sessions, sessions) * 100 AS engagement_rateWe additionally multiply by 100 to get the value immediately as a percentage.
3.1.5 Average engagement time per session Metric
Interaction time is stored inside event_params in the engagement_time_msec parameter. How to work with this nesting we analyzed above. And I already broke down the nuances of calculating this indicator in the previous article in the Average engagement time per user Metric block. The only difference is that there we divided by the number of users, and here it will be the number of sessions.
ROUND(
  SAFE_DIVIDE(
    SUM(
      (SELECT ep.value.int_value FROM UNNEST(event_params) AS ep WHERE ep.key = 'engagement_time_msec' )
    ) / 1000,
    sessions
  ),
  2
) AS avg_engagement_time_per_session
In the query, we convert milliseconds to seconds and divide by the number of sessions. If you want it immediately in minutes, you need to divide by another 60.
ROUND() - can be added as desired to immediately round the value to the usual presentation of percentages with 2 decimal places.
3.1.6 Events per session Metric
Events per session shows the average number of events that occur in one session. Since each individual row in the export table is a separate event, counting the number of events is one of the easiest operations: COUNT(*). The final formula is then:
SAFE_DIVIDE(
  COUNT(*),
  sessions
) AS events_per_session
3.1.7 Event count Metric
By default in the interface, this column is the total count of all events, which equals a simple COUNT(*). But if you want to reproduce the logic of choosing a specific event from a dropdown list (for example, only purchase), we use the COUNTIF function, which counts only those rows where the condition is met:
COUNTIF(event_name = 'purchase') AS event_count3.1.8 Key Events Metric
Although in the interface, for an event to be counted as key, you need to mark it accordingly, in BigQuery there are no such conventions. If needed, any event can instantly become a key one — it's enough just to give it the corresponding name :)
COUNTIF(event_name = 'purchase') AS key_events3.1.9 Session key event rate Metric
This metric answers the question: in what share of sessions did at least one key event occur? Let's break it down using the purchase event as an example. The formula will be as follows:
Session key event rate = number of sessions that had a purchase event / total number of sessions.
I draw attention to a common error: in the numerator, we use not the number of purchases, but the number of sessions in which there was a purchase event. If in one session, for some reason, 2 purchase events occurred — it is still one session for this calculation.
SQL query logic is as follows:
- identify the unique session,
- select only those sessions in which event_name = 'purchase',
- divide the number of such sessions by the total number of sessions.
We get this query:
ROUND(
  SAFE_DIVIDE(
    -- Numerator: number of unique sessions that had a purchase event
    COUNT(
      DISTINCT IF(
        event_name = 'purchase',
        CONCAT(user_pseudo_id, '-', (SELECT ep.value.int_value FROM UNNEST(event_params) AS ep WHERE ep.key = 'ga_session_id')),
        NULL
      )
    ),
    -- Denominator: total number of unique sessions
    sessions
  ) * 100,
  2
) AS session_key_event_rate
3.1.10 Total revenue Metric
Calculating Total revenue is quite simple, since this value is stored in a separate column ecommerce.purchase_revenue. To avoid empty NULL values in the report for those sources that did not bring revenue, we will use the IFNULL function and replace the void with 0:
IFNULL(SUM(ecommerce.purchase_revenue), 0) AS total_revenue3.1.11 Final query: assembling the Traffic Acquisition report in BigQuery
Here we have reached the most interesting part. We have analyzed every brick, every metric, and parameter. Now it's time to merge them into a single SQL query that will reproduce the Traffic Acquisition report from the GA4 interface using the Session source / medium dimension.
For the query to work correctly, we cannot just dump all the formulas into one SELECT block. Why? Because metrics like Engagement rate or Events per session require dividing one metric by another (for example, engaged_sessions / sessions). The BigQuery engine does not allow using newly created column names for math in the same block (at least in normal mode).
That is precisely why we will use the WITH construction (Common Table Expression, or CTE).
The magic of the WITH operator
The WITH operator allows you to create a virtual temporary table (we will call it base_metrics) right during query execution. How it looks in code (Three-level architecture):
- Step 1 (prep_events): Preparation. We extract all nested parameters (session_id, session_engaged, engagement_time) and make convenient columns from them.
- Step 2 (base_metrics): Aggregation. We calculate our COUNT and SUM using already prepared clean columns.
- Step 3 (Final SELECT): Math. We calculate rates, percentages and round them.
Thanks to this, the code becomes modular, readable, and maximally safe.
Here is our final query:
WITH prep_events AS (
  -- LEVEL 1: Data Preparation
  SELECT
    -- Our primary dimension
CONCAT(session_traffic_source_last_click.cross_channel_campaign.source, ' / ', session_traffic_source_last_click.cross_channel_campaign.medium) AS session_source_medium,
    -- Basic event fields
    event_name,
    ecommerce.purchase_revenue,
    -- Extracting parameters from arrays into separate variables
    CONCAT(user_pseudo_id, '-', (SELECT ep.value.int_value FROM UNNEST(event_params) AS ep WHERE ep.key = 'ga_session_id')) AS real_session_id,
    (SELECT COALESCE(ep.value.string_value, CAST(ep.value.int_value AS STRING)) FROM UNNEST(event_params) AS ep WHERE ep.key = 'session_engaged') AS session_engaged,
    (SELECT ep.value.int_value FROM UNNEST(event_params) AS ep WHERE ep.key = 'engagement_time_msec') AS engagement_time_msec
  FROM `project_id.analytics_xxxxx.events_*` -- specify your table here
  WHERE _TABLE_SUFFIX BETWEEN '20251101' AND '20251130' -- specify desired period here
),
base_metrics AS (
  -- LEVEL 2: Aggregation
  SELECT
    session_source_medium,
    COUNT(DISTINCT real_session_id) AS sessions,
    COUNT(DISTINCT IF(session_engaged = '1', real_session_id, NULL)) AS engaged_sessions,
    SUM(engagement_time_msec) AS total_engagement_time_msec,
    COUNTIF(event_name = 'add_to_cart') AS event_count,
    COUNTIF(event_name = 'purchase') AS key_events,
    COUNT(DISTINCT IF(event_name = 'purchase', real_session_id, NULL)) AS sessions_with_purchase,
    IFNULL(SUM(purchase_revenue), 0) AS total_revenue
  FROM prep_events
  GROUP BY 1
)
-- LEVEL 3: Final calculations of percentages and shares
SELECT
  session_source_medium,
  sessions,
  engaged_sessions,
  ROUND(SAFE_DIVIDE(engaged_sessions, sessions) * 100, 2) AS engagement_rate,
  ROUND(SAFE_DIVIDE(total_engagement_time_msec / 1000, sessions), 2) AS avg_engagement_time_per_session,
  ROUND(SAFE_DIVIDE(event_count, sessions), 2) AS events_per_session,
  event_count,
  key_events,
  ROUND(SAFE_DIVIDE(sessions_with_purchase, sessions) * 100, 2) AS session_key_event_rate,
  total_revenue
FROM base_metrics
ORDER BY sessions DESC;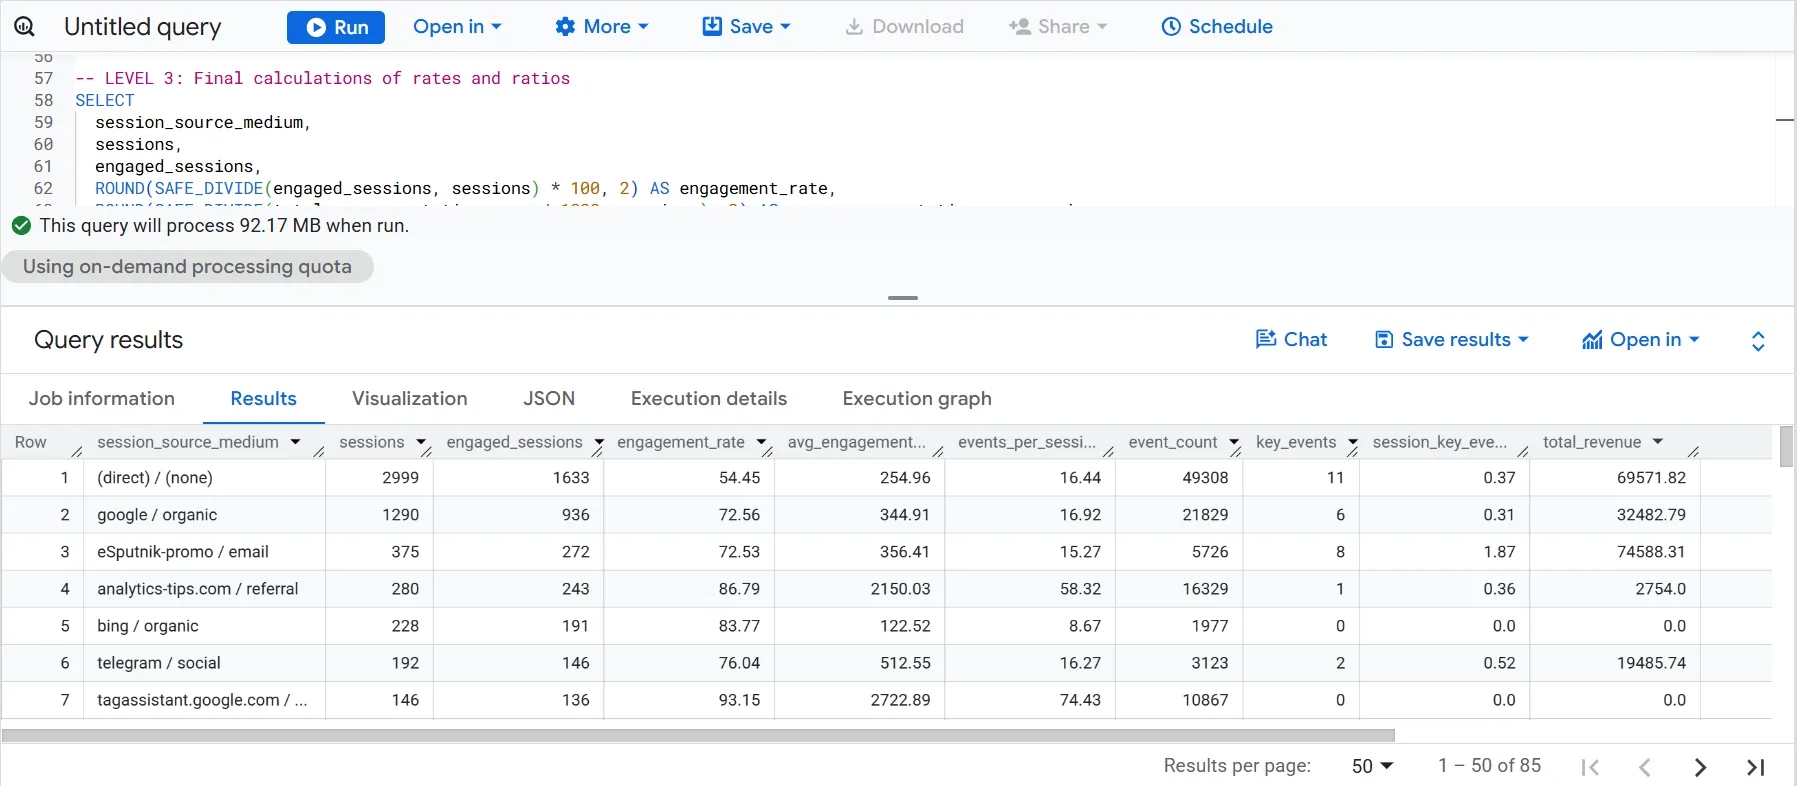
Parameterization: how to make the report universal
In the GA4 interface, you can change the primary dimension of the report with one click in a dropdown list (for example, switch from Source / Medium to Campaign). Our SQL query can do that too! You don't need to rewrite the entire metric calculation logic.
It's enough to change just one first line in the WITH block. For example, if you want to see this same report in the context of advertising campaigns, just replace the session_source_medium definition line with:
session_traffic_source_last_click.cross_channel_campaign.campaign AS session_campaign,Everything else will work automatically since all our metrics are tied to aggregation (GROUP BY 1 will group data by this new first column).
Conclusion
In the second part of my guide, we took another big step toward understanding and reproducing GA4 logic in BigQuery. In this article, we analyzed:
- Preparing raw GA4 data for analysis in BigQuery — why PARSE_DATE, CAST, COALESCE, and CASE WHEN are needed, and exactly how these operators affect the correctness of metrics, aggregations, and subsequent conclusions.
- The logic of attribution in GA4 export tables to BigQuery and why for traffic acquisition analysis you should use the session_traffic_source_last_click object.
- How different data levels work (user / session / event) and why there is no single universal source / medium in GA4. I hope now you clearly distinguish traffic_source, collected_traffic_source, and session_traffic_source_last_click and understand which analytical tasks each of them is suitable for.
- And step-by-step reproduced the Traffic Acquisition report in BigQuery.
In summary: after this part, you have not just a final SQL query, but a clear logic of how to reproduce another GA4 report in BigQuery — with transparent formulas that can be expanded for your own tasks.
If you are just starting to work with GA4 export in BigQuery or feel that you lack confidence in basic things, we recommend starting with the first part of this guide. In it, we analyzed in detail the GA4 export structure, working with nested parameters via UNNEST and scalar subqueries, basic SQL operators, and step-by-step built a Pages and Screens report.
And finally — for those who like to look a little further.
A look into the future (Pipe syntax)
We have just built a full-fledged, "adult" analytical report. It takes into account the features of data types (via COALESCE), protects against division by zero (via SAFE_DIVIDE), and works as transparently as possible.
For those who want to write even more elegant code, Google recently added support for Pipe syntax (|>) to BigQuery. This approach allows reading the query not from the inside out, but strictly from top to bottom — like a conveyor belt at a factory.
Our three-step architecture (Preparation ➝ Aggregation ➝ Metric Calculation) fits this syntax perfectly. Instead of WITH blocks, we use the EXTEND operator to create variables "on the fly."
Here is how stylish and modern our final report will look:
FROM `project_id.analytics_xxxxx.events_*` -- specify your table here
|> WHERE _TABLE_SUFFIX BETWEEN '20251101' AND '20251130' -- specify desired period here

-- Step 1: Preparation
-- Creating convenient variables from nested parameters
|> EXTEND
 CONCAT(session_traffic_source_last_click.cross_channel_campaign.source, ' / ', session_traffic_source_last_click.cross_channel_campaign.medium) AS session_source_medium,
    CONCAT(user_pseudo_id, '-', (SELECT ep.value.int_value FROM UNNEST(event_params) AS ep WHERE ep.key = 'ga_session_id')) AS real_session_id,
    (SELECT COALESCE(ep.value.string_value, CAST(ep.value.int_value AS STRING)) FROM UNNEST(event_params) AS ep WHERE ep.key = 'session_engaged') AS session_engaged,
    (SELECT ep.value.int_value FROM UNNEST(event_params) AS ep WHERE ep.key = 'engagement_time_msec') AS engagement_time_msec

-- Step 2: Aggregation
-- Calculating basic metrics using already prepared clean variables
|> AGGREGATE
    COUNT(DISTINCT real_session_id) AS sessions,
    COUNT(DISTINCT IF(session_engaged = '1', real_session_id, NULL)) AS engaged_sessions,
    SUM(engagement_time_msec) AS total_engagement_time_msec,
    COUNT(*) AS event_count,
    COUNTIF(event_name = 'purchase') AS key_events,
    COUNT(DISTINCT IF(event_name = 'purchase', real_session_id, NULL)) AS sessions_with_purchase,
    IFNULL(SUM(ecommerce.purchase_revenue), 0) AS total_revenue
   GROUP BY session_source_medium

-- Step 3: Final calculations (Extension of metrics)
-- Performing division and rounding based on aggregated data
|> EXTEND
    ROUND(SAFE_DIVIDE(engaged_sessions, sessions) * 100, 2) AS engagement_rate,
    ROUND(SAFE_DIVIDE(total_engagement_time_msec / 1000, sessions), 2) AS avg_engagement_time_per_session,
    ROUND(SAFE_DIVIDE(event_count, sessions), 2) AS events_per_session,
    ROUND(SAFE_DIVIDE(sessions_with_purchase, sessions) * 100, 2) AS session_key_event_rate

-- Step 4: Final sorting and selection of columns for output
|> SELECT
    session_source_medium,
    sessions, engaged_sessions,
    engagement_rate,
    avg_engagement_time_per_session,
    events_per_session,
    event_count,
    key_events,
    session_key_event_rate,
    total_revenue
|> ORDER BY sessions DESC;
Advantages of this approach: You see all data movement as if on the palm of your hand. Every |> is the next stage of processing. Under the hood, both variants (both classic WITH and Pipe) work the same and give the same result, so the final choice remains only yours.
Loading comments…